anhlog
Feb 25, 2022
Writing Feedback / Writing task 1 (Chile's demographic from 1975 to 2035, categorized by age) [2]
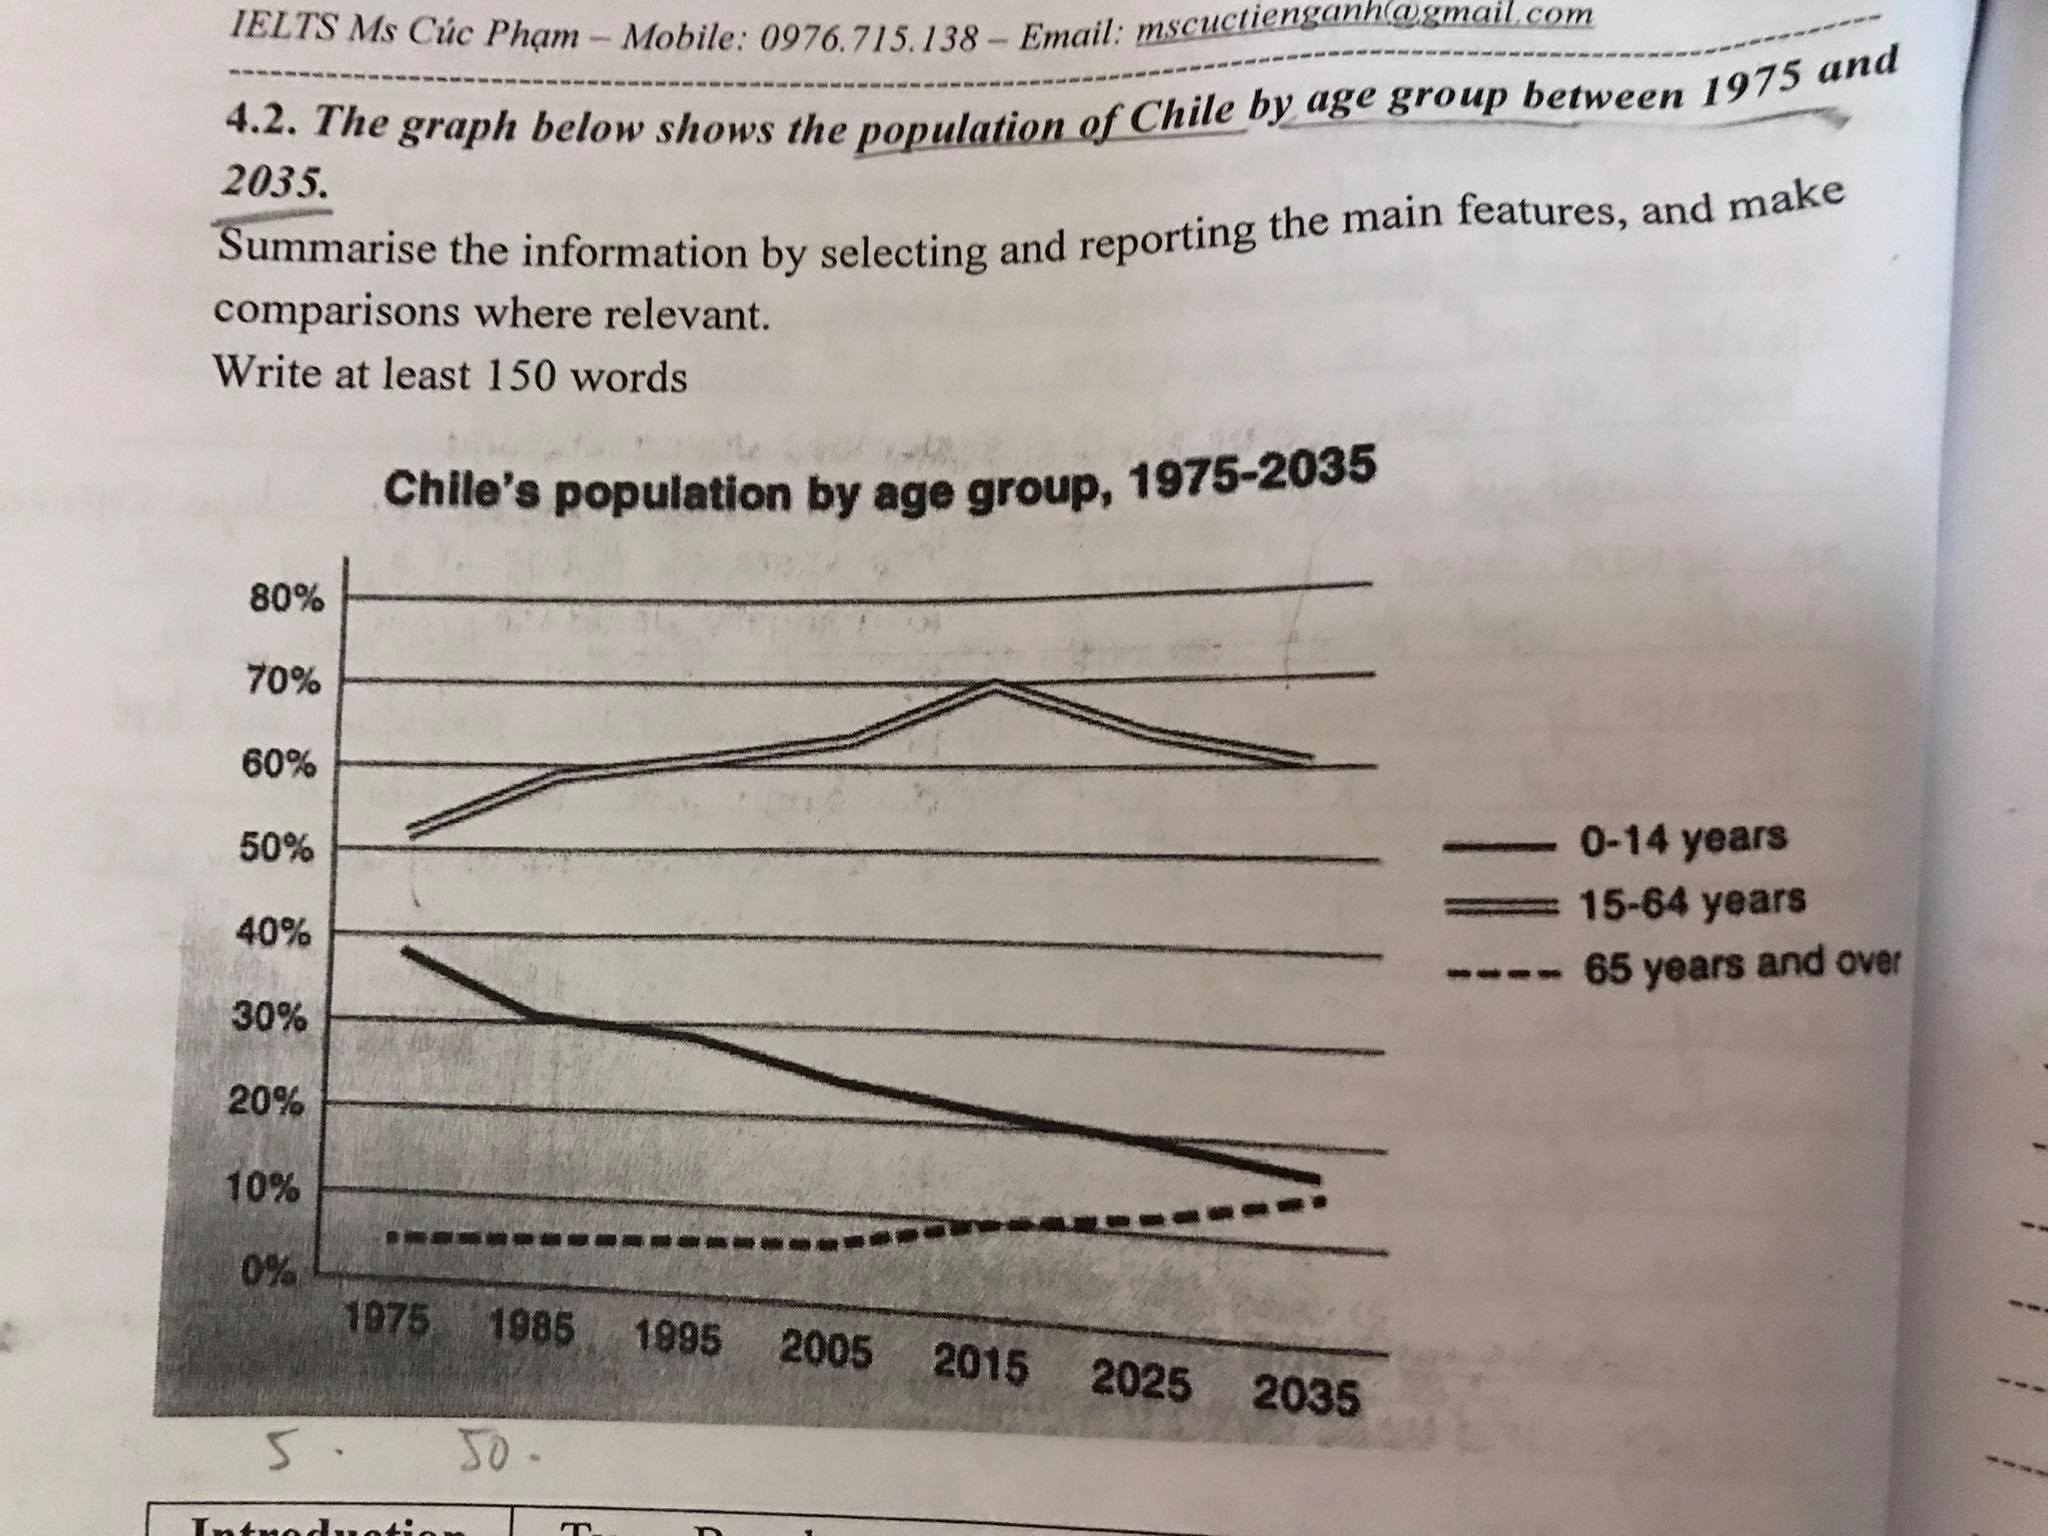
The line graph gives information about Chile's demographic from 1975 to 2035, categorized according to their ages.
Overall, the 15-64 years group has a percentage far surpass than those of the other though at present or future. The proportion of the youngest group has been declining and is expected to keep doing so. In contrast, that of the oldest one has been expressing an opposing trend.
From 1975 to 2015, the graph for oldest people was characterized by a 2- stage upward trend that comprised a slight increase in 1975-2005 and a sharp one in 2005-2015 peaking at 10%. Opposing trends were observed in the others as the number of 15-64 years group increased sharply, peaking at 70% in 2015, and that of the youngest one decreased by roughly 16%.
In the next 20-year period, only the oldest people's proportion is expected to keep rising by approximately 15% in 2035. However, the two aforementioned graphs are projected to reflect the downward trend but at different paces, with the former and the latter respectively reducing from the initial point of 60 and 17 %.
The population of Chile by age group between 1975 and 2035
The line graph gives information about Chile's demographic from 1975 to 2035, categorized according to their ages.
Overall, the 15-64 years group has a percentage far surpass than those of the other though at present or future. The proportion of the youngest group has been declining and is expected to keep doing so. In contrast, that of the oldest one has been expressing an opposing trend.
From 1975 to 2015, the graph for oldest people was characterized by a 2- stage upward trend that comprised a slight increase in 1975-2005 and a sharp one in 2005-2015 peaking at 10%. Opposing trends were observed in the others as the number of 15-64 years group increased sharply, peaking at 70% in 2015, and that of the youngest one decreased by roughly 16%.
In the next 20-year period, only the oldest people's proportion is expected to keep rising by approximately 15% in 2035. However, the two aforementioned graphs are projected to reflect the downward trend but at different paces, with the former and the latter respectively reducing from the initial point of 60 and 17 %.

344098_1_o.jpg
