HuongNg
May 21, 2022
Writing Feedback / The table and bar chart show how journey times in a city centre changed after improvement [7]
The table and bar chart show how journey times in a city centre changed after improvements were made to the transport network, and the cots of using different form of transport in the city. Summarise the information by selecting and reporting the main features, and make comparisons where relevant.
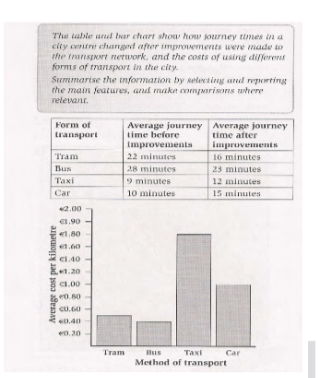
The table shows how long it took to transport around a city before and after the transport network was improved. The bar graph shows how much it cost to use various types of transport.
Traveling by taxi is the fastest way of getting around the city throughout the innovative process, at 9 minutes and 12 minutes respectively. The car experienced the biggest rise in journey times after improvements to the network, from 10 minutes to 15 minutes. The bus is the slowest form of transportation, it takes passengers 28 minutes around the city, but thank to the improvement the average journey time is decreased 5 more minutes to 23 minutes. The tram witnessed the biggest fall in journey times after improvements to the worldwide innovation, from 22 minutes to 16 minutes.
Passengers who travel by taxi have to pay €1.80 per kilometre which is more expensive than car (€1.00). It takes €0.50 per kilometre for traveling by tram while the cheapest form of transport is bus - just €0.4 per kilometre. In a nutshell, depend on distances, the quickest way to travel is taxi but high-priced, otherwise bus is the best way for the pocket.
method of transport
The table and bar chart show how journey times in a city centre changed after improvements were made to the transport network, and the cots of using different form of transport in the city. Summarise the information by selecting and reporting the main features, and make comparisons where relevant.
The table shows how long it took to transport around a city before and after the transport network was improved. The bar graph shows how much it cost to use various types of transport.
Traveling by taxi is the fastest way of getting around the city throughout the innovative process, at 9 minutes and 12 minutes respectively. The car experienced the biggest rise in journey times after improvements to the network, from 10 minutes to 15 minutes. The bus is the slowest form of transportation, it takes passengers 28 minutes around the city, but thank to the improvement the average journey time is decreased 5 more minutes to 23 minutes. The tram witnessed the biggest fall in journey times after improvements to the worldwide innovation, from 22 minutes to 16 minutes.
Passengers who travel by taxi have to pay €1.80 per kilometre which is more expensive than car (€1.00). It takes €0.50 per kilometre for traveling by tram while the cheapest form of transport is bus - just €0.4 per kilometre. In a nutshell, depend on distances, the quickest way to travel is taxi but high-priced, otherwise bus is the best way for the pocket.

AnhchupManh.png
