Writing Feedback /
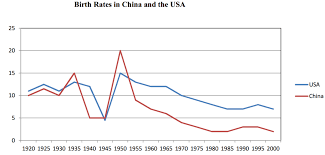
The Graph Bellow Compares Changes In The Birth Rates Of China And USA Between 1920 And 2000. [4]
fertility rate in China And USA
The line graph illustrates how the fertility rate changed in two various countries over an 80-year period, starting from 1920.
Overall, a gradual decrease was witnessed in the percentage of birth in China and the USA. It is noticeable that the proportion of fertility in the USA was the highest over most of the period.
In 1920, the rate of fertility in the USA stood at over 22%, higher than 20% of China's birth rate. During the next 15 years, the percentage of birth in both China and the USA fluctuated prior to increasing to nearly 25% and 23% respectively. After falling to 5% and remaining stable, the proportion of birth in China saw a significant upwards to reach a peak of 15% in 1950. Similarly, the fertility rate of the USA declined to the lowest point of nearly 5% in 1954 but later rose to 25% during the period.
In the next 50 years, a sudden downtrend of about 17% was seen in the birth rate of China before fluctuating between 3% and 4%. A similar pattern was seen in the percentage of birth in the USA, as it went down gradually to approximately 7% during most of the period.

tixung.png

