khain43
Jul 16, 2022
Writing Feedback / The comparison of water consumption for industrial, agricultural, and domestic purposes [2]
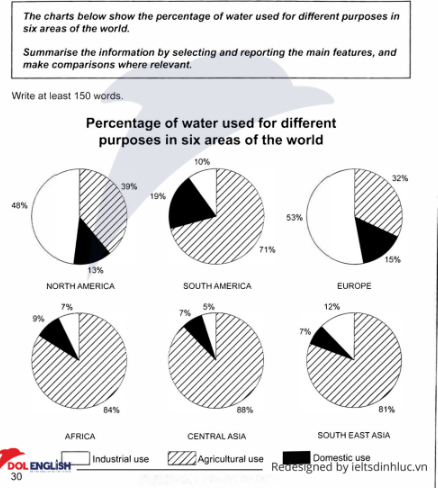
The pie graph provides a comparison of water consumption for three different purposes including industrial, agricultural, and domestic in six areas of the world.
From an overall perspective, it is evident that all areas spent the most significant proportion of water used on agriculture. However, North America and Europe used water largely in the industrial sector. Agricultural used water was highest in Africa, central Asia, and Southeast Asia with a percentage higher than 80% while domestic and industrial allocated at lower than 20%.
Regarding North America and Europe quite similar the proportion of water used when the percentage of industrial respectively 53% and 48%. Around 30% - 40% of the water is used by agriculture and around 15% for domestic use in both these regions. For South America, agricultural use of water is 71% of the total, and industrial and domestic use make up for 19% and 10% of the total, respectively.
IELTS TASK 1 - Water Usage
The pie graph provides a comparison of water consumption for three different purposes including industrial, agricultural, and domestic in six areas of the world.
From an overall perspective, it is evident that all areas spent the most significant proportion of water used on agriculture. However, North America and Europe used water largely in the industrial sector. Agricultural used water was highest in Africa, central Asia, and Southeast Asia with a percentage higher than 80% while domestic and industrial allocated at lower than 20%.
Regarding North America and Europe quite similar the proportion of water used when the percentage of industrial respectively 53% and 48%. Around 30% - 40% of the water is used by agriculture and around 15% for domestic use in both these regions. For South America, agricultural use of water is 71% of the total, and industrial and domestic use make up for 19% and 10% of the total, respectively.

Capture.PNG
