linhkn
Sep 4, 2022
Writing Feedback / The line graph gives data about four sectors in terms of the amount of acid rain emissions in the UK [2]
IELTS WRITING TASK 1
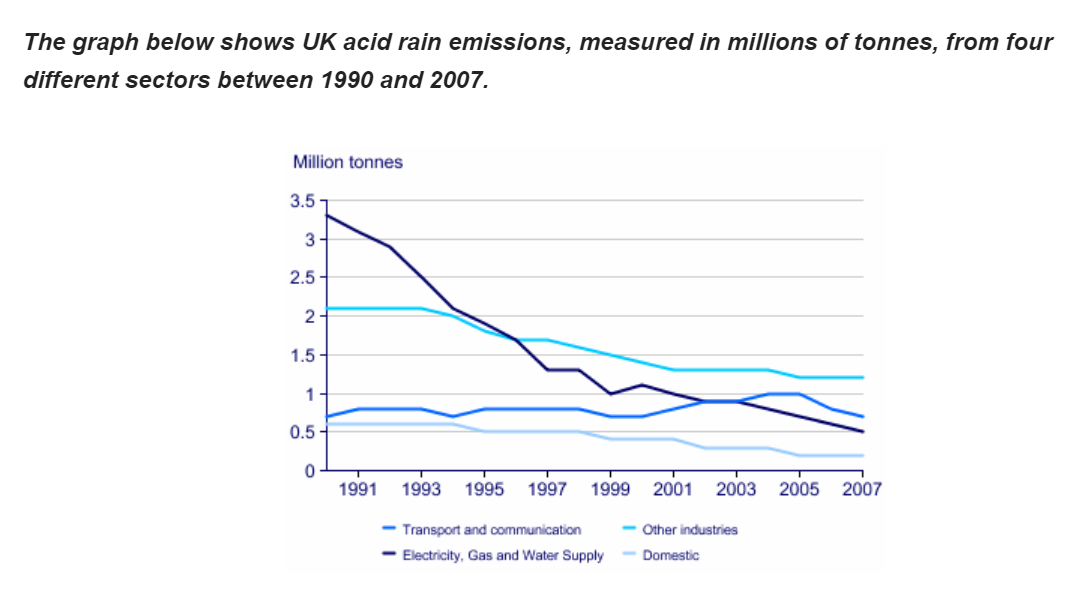
The line graph gives data about four sectors in terms of the amount of acid rain emissions that were produced in the UK over a period of 17 years.
It is clear that the amount of acid rain emissions in the UK went down dramatically from 1990 to 2007. The most significant decrease was witnessed in the Electricity, Gas and Water supply sector.
In 1990, around 3.3 million tonnes of acid rain emissions came from Electricity, Gas and Water supply. The Transport and Communication sector was responsible for 0.7 million tonnes of emissions while the Domestic sector produced about 0.6 million tonnes. Just over 2 million tonnes of acid rain gases came from Other Industries.
Emissions from Electricity, Gas and Water supply fell considerably to only 0.5 million tonnes in 2007, a decline of almost 3 million tonnes. Whereas acid rain gases from the Domestic and Other Industries sector fell slightly, the Transport and Communication sector saw a modestly increase in emissions, hit a record-high of 1 million tonnes in 2005.
IELTS WRITING TASK 1
UK acid rain emissions
The line graph gives data about four sectors in terms of the amount of acid rain emissions that were produced in the UK over a period of 17 years.
It is clear that the amount of acid rain emissions in the UK went down dramatically from 1990 to 2007. The most significant decrease was witnessed in the Electricity, Gas and Water supply sector.
In 1990, around 3.3 million tonnes of acid rain emissions came from Electricity, Gas and Water supply. The Transport and Communication sector was responsible for 0.7 million tonnes of emissions while the Domestic sector produced about 0.6 million tonnes. Just over 2 million tonnes of acid rain gases came from Other Industries.
Emissions from Electricity, Gas and Water supply fell considerably to only 0.5 million tonnes in 2007, a decline of almost 3 million tonnes. Whereas acid rain gases from the Domestic and Other Industries sector fell slightly, the Transport and Communication sector saw a modestly increase in emissions, hit a record-high of 1 million tonnes in 2005.

Screenshot2022090.png
