studyingwithjane
Nov 27, 2022
Writing Feedback / Three unhealthy nutrients in American daily menu - the pie charts [2]
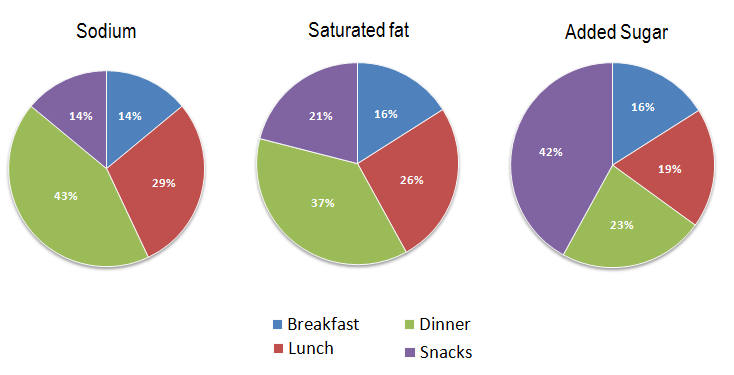
The pie charts illustrate the percentage of nutrients combined by Americans that could be unhealthy if they ate too much
Overall, looking at the graph, it is immediately obvious that the amount of sodium and saturated fat was predominantly consumed at dinner which was eaten in snacks
In the first graph, the figure for sodium was the highest consumption for dinner is 43% and then breakfast and snacks had the same number that is 14%. Besides, lunch where has 29% of sodium. In the next graph, 37% of fat was used in dinner while this number was only 21% and 16% respectively, snacks and breakfast. There 26% of fat was seen in lunch
In the third graph, the amount of sugar was mostly used in snacks, whereas in breakfast, it had 16%. In addition, the figure for sugar which was used in lunch had 19% and 25% for dinner
The pie charts illustrate the percentage of nutrients combined by Americans that could be unhealthy if they ate too much
Summarise information from the charts
Overall, looking at the graph, it is immediately obvious that the amount of sodium and saturated fat was predominantly consumed at dinner which was eaten in snacks
In the first graph, the figure for sodium was the highest consumption for dinner is 43% and then breakfast and snacks had the same number that is 14%. Besides, lunch where has 29% of sodium. In the next graph, 37% of fat was used in dinner while this number was only 21% and 16% respectively, snacks and breakfast. There 26% of fat was seen in lunch
In the third graph, the amount of sugar was mostly used in snacks, whereas in breakfast, it had 16%. In addition, the figure for sugar which was used in lunch had 19% and 25% for dinner

Summarize the information by selecting and reporting the main features, and make comparisons where r
