moonsun06_56
Feb 11, 2023
Writing Feedback / The bar chart below gives information about four countries' spending habits of shopping on consumer [2]
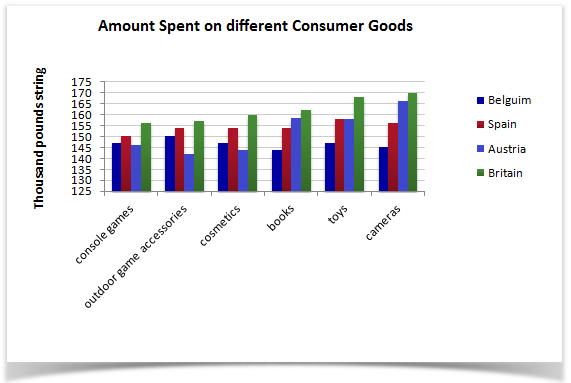
The given bar chart compares how much money the shoppers in four European nations spent on six different items, namely console games, outdoor game accessories, cosmetics, books, toys, and cameras in 2012.
Overall, Britain surpassed the other countries in the amount for purchasing all these products while the Belgians expended the least amount.
It can be observed that the British spent the highest amount of money on cameras and toys, more than 165 thousand pounds for each. Also, over 155 thousand pounds were expended on each of the other goods. Austria stood at the second position in the amount for books, toys, and cameras, with nearly 160 thousand pounds each. However, the amount of money spent on the former three products was the lowest expense.
Moving on, Spain expended more money on all goods than Belgium, which ranked last, at over 150 and under 150 thousand pounds for each, respectively.
amount spent on different consumer goods
The given bar chart compares how much money the shoppers in four European nations spent on six different items, namely console games, outdoor game accessories, cosmetics, books, toys, and cameras in 2012.
Overall, Britain surpassed the other countries in the amount for purchasing all these products while the Belgians expended the least amount.
It can be observed that the British spent the highest amount of money on cameras and toys, more than 165 thousand pounds for each. Also, over 155 thousand pounds were expended on each of the other goods. Austria stood at the second position in the amount for books, toys, and cameras, with nearly 160 thousand pounds each. However, the amount of money spent on the former three products was the lowest expense.
Moving on, Spain expended more money on all goods than Belgium, which ranked last, at over 150 and under 150 thousand pounds for each, respectively.

pic.png
