hnathu
Feb 13, 2023
Writing Feedback / IELTS WRITING TASK 1: The chart shows requests for information at a tourist office in the UK [2]
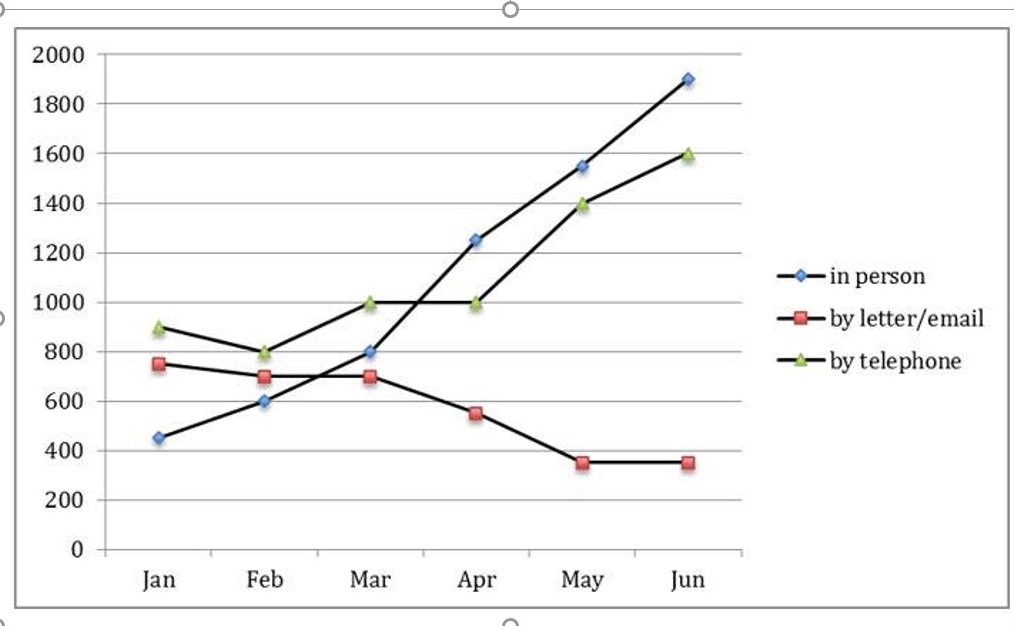
The line graph compares the number of inquiries for information in three different ways at a tourist centre in the United Kingdom in the first half of a year.
Overall, the number of requests for information at the UK tourist office by telephone and in person increased from January to June. At the same time, the figures for questions from letters or emails decreased.
In more detail, starting with 900 questions in January, the number of inquiries made by telephone increased to 1000 in March despite a fluctuation, remaining the most popular way to ask tourist questions throughout the period. Being the second most popular way to make requests in January with 800 requests, the figures for written questions witnessed a gradual decrease of 200 requests after 2 months. Meanwhile, made least at 400 requests, the number of direct requests doubled in March, exceeding requests via telephone.
From March to June, the number of requests by telephone to the tourist office continued to go up and reached its peak at 1600 in June, which was nearly twice as much as that of the initial start. Experiencing an opposite pattern, the figures for letters or electronic mail hit the bottom at about 400, being the least popular way of asking for information. It seemed that United Kingdom people continually made requests more and more in person, making the figures for face-to-face questions sharply rose to 1900 requests and surpassing all other mentioned figures.
inquiries: in person, by letter/email, and by telephone
The line graph compares the number of inquiries for information in three different ways at a tourist centre in the United Kingdom in the first half of a year.
Overall, the number of requests for information at the UK tourist office by telephone and in person increased from January to June. At the same time, the figures for questions from letters or emails decreased.
In more detail, starting with 900 questions in January, the number of inquiries made by telephone increased to 1000 in March despite a fluctuation, remaining the most popular way to ask tourist questions throughout the period. Being the second most popular way to make requests in January with 800 requests, the figures for written questions witnessed a gradual decrease of 200 requests after 2 months. Meanwhile, made least at 400 requests, the number of direct requests doubled in March, exceeding requests via telephone.
From March to June, the number of requests by telephone to the tourist office continued to go up and reached its peak at 1600 in June, which was nearly twice as much as that of the initial start. Experiencing an opposite pattern, the figures for letters or electronic mail hit the bottom at about 400, being the least popular way of asking for information. It seemed that United Kingdom people continually made requests more and more in person, making the figures for face-to-face questions sharply rose to 1900 requests and surpassing all other mentioned figures.

SharedScreenshot.jpg
