claireorg
Feb 22, 2023
Writing Feedback / TASK 1 the percentage of people of different age groups who watched a movie in cinema once a month [5]
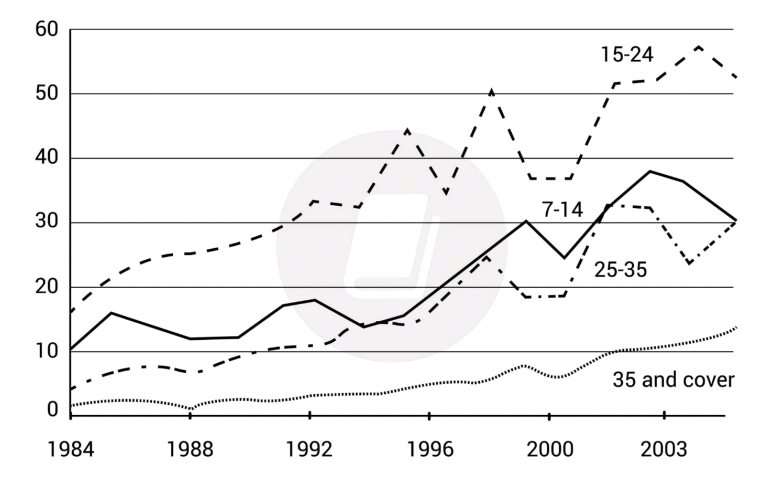
The chart below shows the percentage of people of different age groups who went to the cinema once a month or more in the UK from 1984 to 2003
The given chart illustrates the proportion of people of different age groups who watched a movie in cinema once a month or more in UK from 1989 to 2003
Overall, we can see that people who aged from 15-24 took up a significant percentage. In contrast, the number of people from 35 and cover age group was really low.
In 1984, the proportion of 15-24 aged people accounted for only 18%. After the period of fluctuation, this figure reached the highest peak at almost 60%, ranked first in the age groups. Besides, the figure for people from 35 and cover was 2% in the first year. There was no noticeable change after 19 years. In 2003, this figure increased to 15%.
From the graph, 7-14 aged people rise by 25% (from 10% to 35%) and show a downward trend in the future. The period from 1984 to 2003 witnessed an unstable change in the percentage of people from 25 to 35. This figure fluctuated from 5% to 15%.
cinema attendance in the UK from 1984 to 2003
The chart below shows the percentage of people of different age groups who went to the cinema once a month or more in the UK from 1984 to 2003
The given chart illustrates the proportion of people of different age groups who watched a movie in cinema once a month or more in UK from 1989 to 2003
Overall, we can see that people who aged from 15-24 took up a significant percentage. In contrast, the number of people from 35 and cover age group was really low.
In 1984, the proportion of 15-24 aged people accounted for only 18%. After the period of fluctuation, this figure reached the highest peak at almost 60%, ranked first in the age groups. Besides, the figure for people from 35 and cover was 2% in the first year. There was no noticeable change after 19 years. In 2003, this figure increased to 15%.
From the graph, 7-14 aged people rise by 25% (from 10% to 35%) and show a downward trend in the future. The period from 1984 to 2003 witnessed an unstable change in the percentage of people from 25 to 35. This figure fluctuated from 5% to 15%.

332297342_1657979194.png
