Unanswered [0]
  

Posts by Ann17
Name: An
Joined: Jul 7, 2023
Last Post: Jul 10, 2023
Threads: 2
Posts: 4  
From: Viet Nam
School: UEL

Displayed posts: 6
sort: Latest first   Oldest first  | 
Ann17   
Jul 10, 2023
Writing Feedback / Job applicants'social skills are more important than academic qualifications [3]

I'm not good at writing skill so I can give you an advice. When you take example about Bill Gates and Mark Zuckerbug, there are some points which are not accuracy. I read an exmaple about Bill Gates and Mark Zuckerbug, I believe that they are not only good at socical skills but also in their knowledge and major. Because when they can attend Harvard, it means they are very smart and talent. Havard is a school which has a lot of students who got an outstanding points in SAT. In this scholl, they just admit about 4%-6% of students who apply. I don't know exactly how many people apply it but I can say that there are a lot of people who apply in this school. Moreover, all of them have an impressive background so you can know that how brilliant Bill Gates and Mark Zuckerbug are. In addition, their parents have a lot of money and they let their children study in great school. Therefore, I think that their achievements are not made because of their social skills. They can success due to their knowledges, their talents and qualities in them. This is my advice. I'm not sure if they are right. If they can help you to improve your essay, it's very great. Good night.
Ann17   
Jul 8, 2023
Writing Feedback / Task 1: Line graph: the number of public transit passengers from 1989 to 2009 .. [3]

the number of public transit passengers - graph analysis


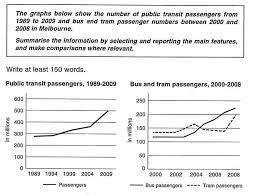
The graphs below show the number of public transit passengers from 1989 to 2009 and bus and tram passenger numbers between 2000 and 2008 in Melbourne.
Summarise the information by selecting and reporting the main features, and make comparisons where relevant.

Aswer
The first line graph gives the information on using public transportation from 1989 to 2009, and the second line graph provides the passenger data for buses and trams between 2000 and 2008 in Melbourne.

In common, there was an upward trend of the ridership number of public transit from 1989 to 2009. More specifically, even though bus and tram passengers both increased from 2000 to 2008, there was a growth in bus riders.

According to the first graph, the number of ridership of transportation increased slightly in 1994, nearly 300 million. After 1994, for the data of ridership of transportation, it grew significantly, about 350 million passengers in 2004, when it started to surge dramatically in 2009, about 500 million.

In the second graph, the total number of bus uses was unchanged from 2000 to 2002, but between 2022 and 2008, it reached a high by around 100 million. Moreover, in 2004, the amount of using bus was passed away the number of using tram. As for tram uses, from 2000 and 2002, it was still higher than bus uses, about 20 million although it remained. After that, it increased slowly in 2004, about 160 million but it declined slightly in two years after. Then, at the end of the year 2006, it surged, reaching approximately about 200 million in 2008. However, the amount of tram use was fewer than the amount of bus use.

Note: If you can, please give me a mark for this essay.
Thanks


  • tixung.jpg
Ann17   
Jul 7, 2023
Writing Feedback / Task 1: Line graph: the usage of oil in four different countries from 1966 to 2006 [5]

the usage of oil in four different countries


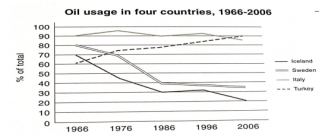
The graph below shows the usage of oil in four different countries between 1966 and 2006 as a percentage of total energy use within each nation.
Summarize the information by selecting and reporting the main features, and make comparisons where relevant
Answer
The given line graph provides the information about the percentage of using oil in Iceland, Sweden, Italy and Turkey from 1966 to 2006.
At the first glance, it is clear that there are several changes from 1966 to 2006. In 1966, the figure of Iceland was the highest and the figure Turkey was the lowest in four countries. In that time, proportions fluctuated over the forty-year period and in 2006, the number of Iceland was the second and the number of Turkey was the tallest.

According to the chart, between 1996 and 1986, the number of using oil Italy went down significantly from 70% to 30% and it was the lowest. From 1966 to 1986, the figure of using energy Sweden decreased quickly about 80% to 40%. Moreover, the average amount of using oil Sweden in 1986 was two times as high as it in 1966. While in Turkey, percentages rose rapidly 80%, the percentage of using oil in Iceland remained. Although, there was nearly no change in the using oil in Iceland, it was still the highest. In addition, the number of using oil in Turkey was the second.

As can be seen that, from 1986 to 2006, in Sweden, Iceland and Italy, there was a significant decrease in the amount of using oil at 35%, 85% and 20%. Furthermore, the number in Italy was the lowest. Whereas number of using oil in the other countries downward, the figure in Turkey increased and peaked at 90% that it was the highest.


  • Untitled_123.png
ⓘ Need Writing or Editing Help?
Fill out one of these forms for professional help:

Best Writing Service:
CustomPapers form ◳

Graduate Writing / Editing:
GraduateWriter form ◳

Excellence in Editing:
Rose Editing ◳

AI-Paper Rewriting:
Robot Rewrite ◳