fnuruladilah
Aug 29, 2023
Writing Feedback / The chart bar about consumer in 3 category who consumption fruit and vegetable. [2]
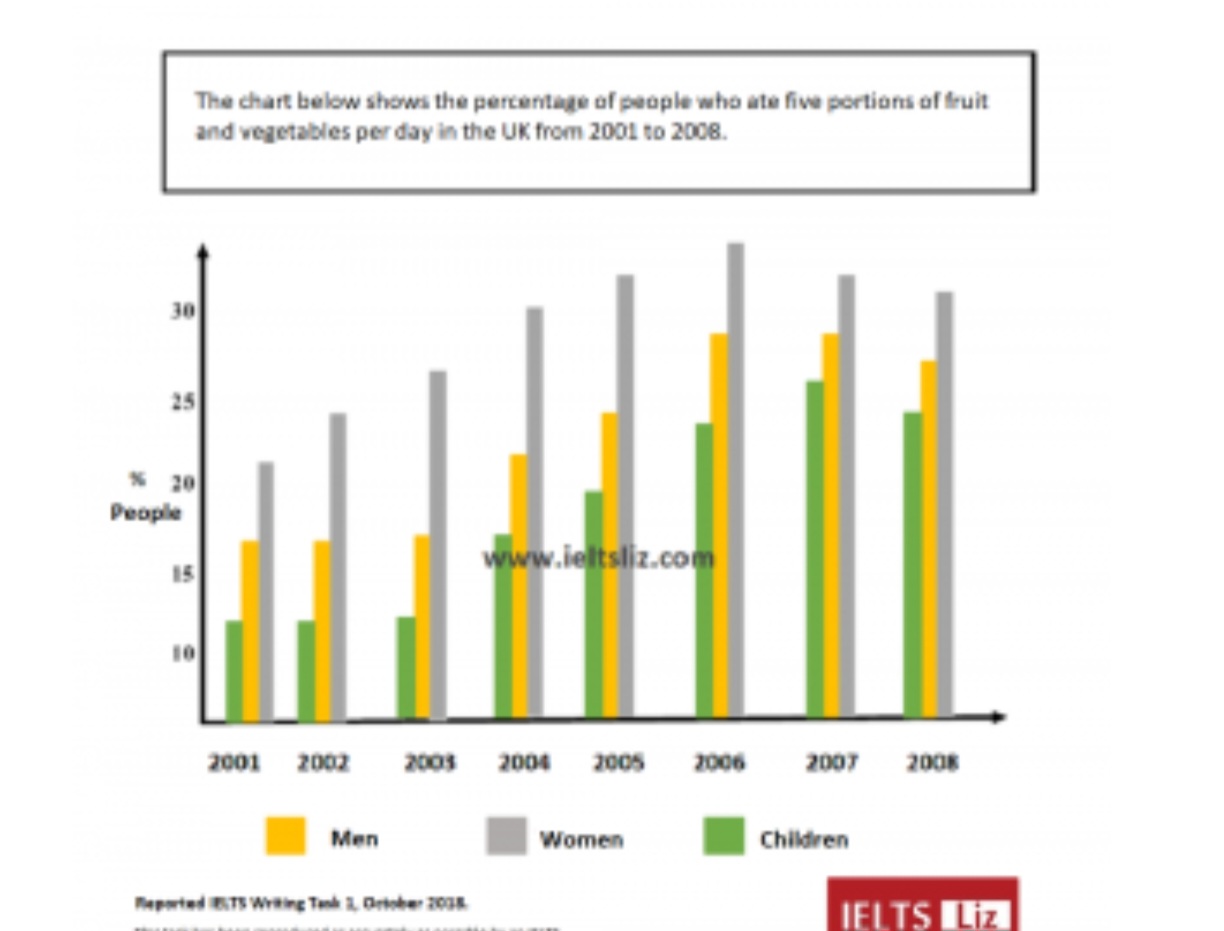
The bar chart provides illustrates 3 categorie consumer in Uk who consumption of fruit and vegetables per day from 2001 to 2008. It is measured in percentages. Overall it can be seen that increased as a percentage of consumption of the both food occur in 2006 with the percentage is more than 30 with the woman consumer.
At the beginning of the period that is 2001 till 2008 overall occur significantly increase amount consumption fruit and vegetable in children with the huge percentage were happened in 2007 with the percentage around 25. Even though the percentage is significant but children category has less consumption vegetable and fruit compared to other category.
In the other hand man consumer have a huge percentage from the first period in 2001 they consumption both of the food around 20% and year by year go up to more than 30% in 2006, nevertheless in 2007 and 2008 occur decreased touched number below 30%.
people who ate five portions of fruit and vegetable
The bar chart provides illustrates 3 categorie consumer in Uk who consumption of fruit and vegetables per day from 2001 to 2008. It is measured in percentages. Overall it can be seen that increased as a percentage of consumption of the both food occur in 2006 with the percentage is more than 30 with the woman consumer.
At the beginning of the period that is 2001 till 2008 overall occur significantly increase amount consumption fruit and vegetable in children with the huge percentage were happened in 2007 with the percentage around 25. Even though the percentage is significant but children category has less consumption vegetable and fruit compared to other category.
In the other hand man consumer have a huge percentage from the first period in 2001 they consumption both of the food around 20% and year by year go up to more than 30% in 2006, nevertheless in 2007 and 2008 occur decreased touched number below 30%.

Screenshot_20230829_.jpg
