Writing Feedback /
Different Forms of Entertainment ( Bar Graph) Task 1 [3]
This is my first essay on IELTS. I am looking forward your comments and recommendations about my essay. Please, also dont forget evaluate it ). Thanks in advance
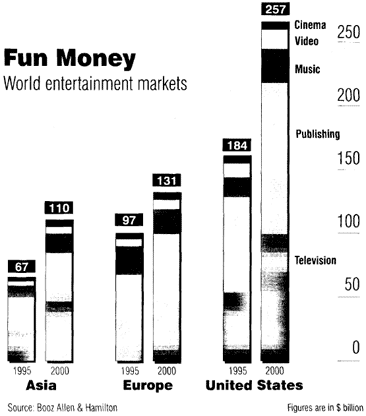
Q: The graph below shows how money was spent on different forms of entertainment over a five-year period. Write a report for a university lecturer describing the information shown below
A: The graph gives us the information about the expenditure of four forms of entertainment between 1995 and 2000 in Asia, Europe and United States. It can be clearly seen that there is an upward trend in all kinds of entertainment mentioned in the graph.
The field which was spent the most money is publishing by US: 75 bln in 1995 and over 100 bln in 2000. The cost of publishing in US is more than the overall expenditure of Asia in 2000. Television market increased by 100% ( from 50 bln to 100 bln). Although cinema, video and music spending is rising, it is less than 40 billion altogether.
Europe takes an average position. Over a five-year period, publishing went up to nearly twice. Television and cinema, video rose, while music fluctuated in five years. Albeit, Asia spends least in three world markets, the amount of money spent between 1995 and 2000 is more than the one of Europe. All kinds of entertainment virtually increased twice
All in all, US has kept tis domineering position in five years. the Unidet States spends more money on entertainment than Asia and Europe together.
Word Count: 192

funmoney1.png

