narsis_sh83
Jan 9, 2012
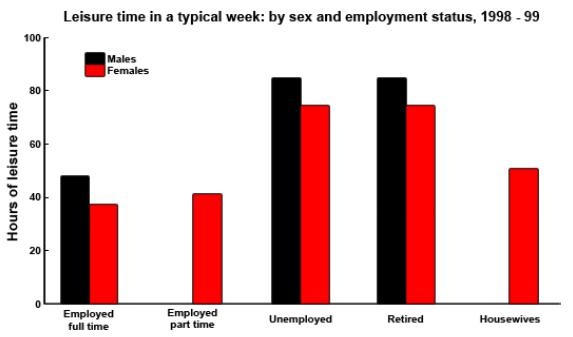
Writing Feedback / The chart below shows the amount of leisure time enjoyed by men and women [2]
The below chart compares the hours of leisure time in a different weeks between men and women in various situation of their employment in year of 1998 to 1999.
As we can see men who employed full time spent a little more time than women for leisure time. This amount is about 45 hours in a week but for women is about 40 hours. In part-time situation men had no time for leisure time but women spent 40 hours for leisure time. There is same result in unemployed and retired situation. In both of them men spent more than women time for leisure time approximately, 85 hours and women spent near to 80 hours. This is exactly two more than when they were full time employed. In the at least just female were housewives on that year, so they spent around 45 hours for leisure time.
It is clearly that in same situation for men and women in 1998-1990 men had more leisure time, also part-time job and housewives were just for women.

1.jpg
