Writing Feedback /
IELTS Academic Writing Task 1 : Adult Education (Pie graphs) [4]
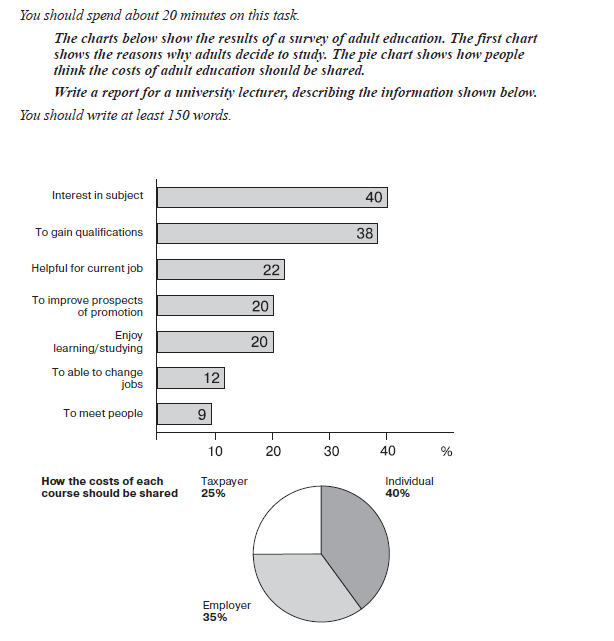
The bar chart shows the reasons why adults decide to study while the pie graphs indicates how people think the costs of adult education should be shared.
According to the first graph, interest in subject and to gain qualifications are the most popular reasons with 40% and 38% while to able to change job and meeting people are the last populars with 12% and 9%, respectively. Around 20 % of people want to be helpful for current job, to improve prospects and promotion or they enjoy studying.
As it can be seen in the pie chart, people think that they should pay 40% of the costs invidual while employers pay 35% of it. Taxpayers should be responsible for the rest of the costs.
All in all, it is obvious that most of adults want to study just for interest and pay most of the education fee invidual.
--------------------------------
Thank you for comments.
I am preparing for IELTS exam. I should have at least 6.5..

160658_1_o.png

