JennyPham
Feb 11, 2014
Writing Feedback / The chart below display skill levels of male and female employees in a British company in [5]
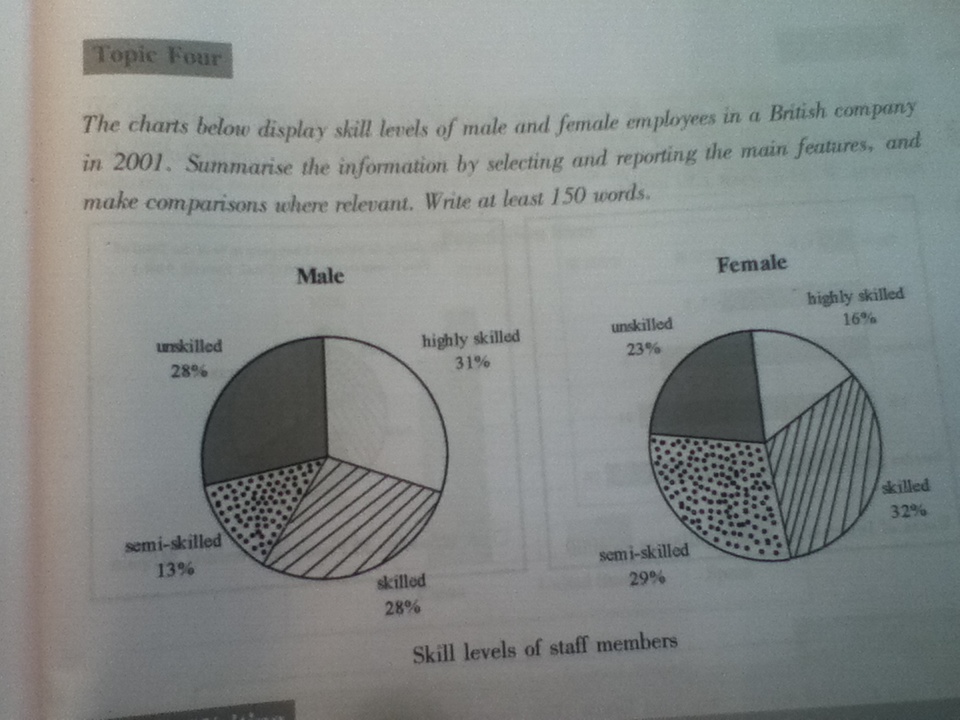
The chart below display skill levels of male and female employees in a British company in 2001. Summerise the information by selecting and reporting the main features, and make comparision where relevant. Write at least 150 words.
Please look over the personal statement and let me know the areas for improvement. What I should delete and what I should elaborate on maybe. Give me some good advice. I will be very thankful!
The pie chart illustates the levels of skillfullness of male and female staff members at a company in British in 2001.
It is clearly that the percentage of male with highly skilled is nearly as twice as the category in female, 31% male with highly skilled is much higher than 16% famale's.
There is no much disparity in skilled part between male workforce and female staff, which are 28% and 32% respectively. The following numbers show that the proportion of skilled male is 4% higher than this female's.
Female wokers dominated in semi-skiiled with 29% while it is only 13% of male staff, lower 6% compare with female.
28% of unskilled male workes, a little bit more than 23% of this category in female, only 5% higher.
On the whole, males are slightly better at skills than females, that was shown in the pie chart by the comparison between 59% and 48%.

IMG_05871.JPG
