upinipin
Apr 10, 2014
Writing Feedback / IELTS TASK 1; Cinema attendance in the UK [9]
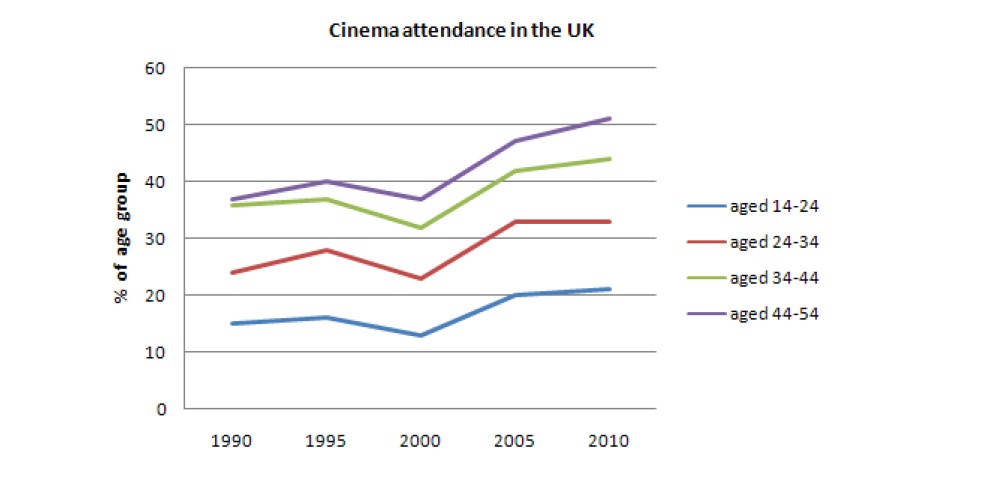
The chart illustrates british attendance in cinema. persentation of age group in five yaers. the line graph shows percentageof each age of british in every year who attend the cinema.
In general, it can b seen to the graph taht the number of british who attend the cinema increased slowly from 1990 to 2010.
in 1990 to 2000, aged 14 to 54 the graph relative fluctuated. instead aged 14 to 54 decline sharply. in 1995 to 2000, probably this is caused by decreasing of production film as long as this years. since year 2000 to 2010 the graph rose sharply, speciallly in aged 44 to 54. though aged 24 to 34 the graph remained reasonably steady but it is not give big affect to the aged other graph.
overall, cinema attendance in the UK rose shaprhly in all the time of years from 1990 to 2010.