Unanswered [9] | Urgent [0]
  

Posts by ismawan [Suspended]
Name: Ismawan Amir
Joined: Jun 12, 2014
Last Post: May 17, 2016
Threads: 2
Posts: 3  
Likes:
From: Indonesia
School: UK English Institute

Displayed posts: 5
sort: Latest first   Oldest first  | 
ismawan   
May 17, 2016
Writing Feedback / IELTS TASK 1 - The chart below gives information about science qualifications held by people [3]

Please put your strong comment..Best Regard

QUESTION

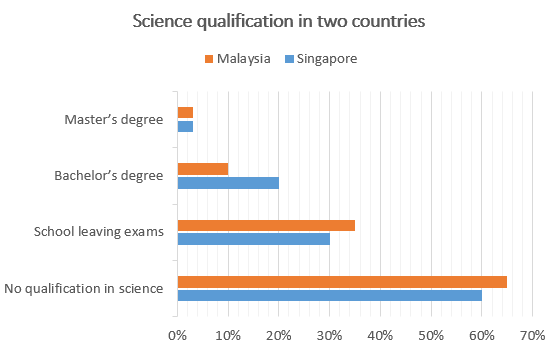
The chart below gives information about science qualifications held by people in two countries.

ANSWER

The provided bar graph compare the percentage of science qualification held by people in Malaysia and Singapore. As is presented in the graph, no qualification in science gets the highest number of people in these country.

At a closer look to the figure, it can be seen that the lower percentage of people hold science qualification which is Master's Degree. It just approximately 5 % in Malaysia and Singapore. The condition of qualification same as these country. People hold Bachelor's degree in Malaysia 20 %. It is higher than Malaysia which gets 10 %.

In Malaysia, the participation to join leaving exams in science increases than in Singapore. Aproximately people reach 35 % in Malaysian and 30 % in Singapore. The Highest percentage is no qualification in science. We find in Malaysia up to 60 % till 65 % and in Singapore in 60 %


ismawan   
May 17, 2016
Writing Feedback / IELTS TASK 1- The chart below gives information about the most common sports played in New Zealand [3]

Hello, i'm Mao. This is my first post in essay forum
Could you give a strong critical comment? as a leraners i very hope feedback from all member. i believe it can improve y skill in writing task. Thanks

Question :

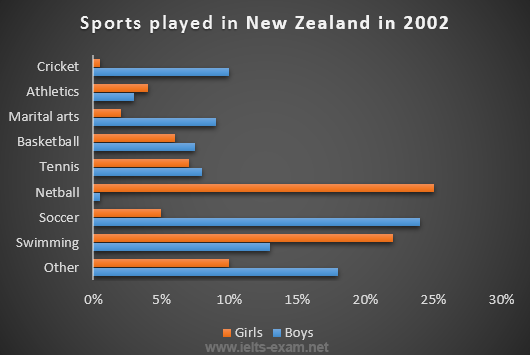
The chart below gives information about the most common sports played in New Zealand in 2002.
Summarise the information by selecting and reporting the main features, and make comparisons where relevant.


Answer :

The given bar graph illustrates information about the number of sports played in New Zealand by girls and boy with different sports in 2012. As is observed from the graph, both of them describe that their participatory in sports is almost same. However, the preference of their sports is different.

The bar graph compares of sports by girls and boy and compare with percentation between girls and boys. Soccer is the most popular sport among the boys, with percentation reaching 25 percent. It is similar with netball. The percentation approximately 26 percent. This is a famous sport by girls.

A few girls chooses a game of cricket while boys takes part in this game almost 10 percent. Boys and Girls play swimming in 13 percent and almost 22 percent. It becomes popular sport of them. On the other hand, the kind of sports such as tennis, basketball, and martial arts are not popular sports.


Do You Need
Academic Writing
or Editing Help?
Fill in one of the forms below to get professional help with your assignments:

Graduate Writing / Editing:
GraduateWriter form ◳

Best Essay Service:
CustomPapers form ◳

Excellence in Editing:
Rose Editing ◳

AI-Paper Rewriting:
Robot Rewrite ◳