mo7ammed1986
Jun 28, 2014
Writing Feedback / IELTS academic task one .. bar chart - coffee and meat consumption [5]
the question is attached in the picture
here is my answer:
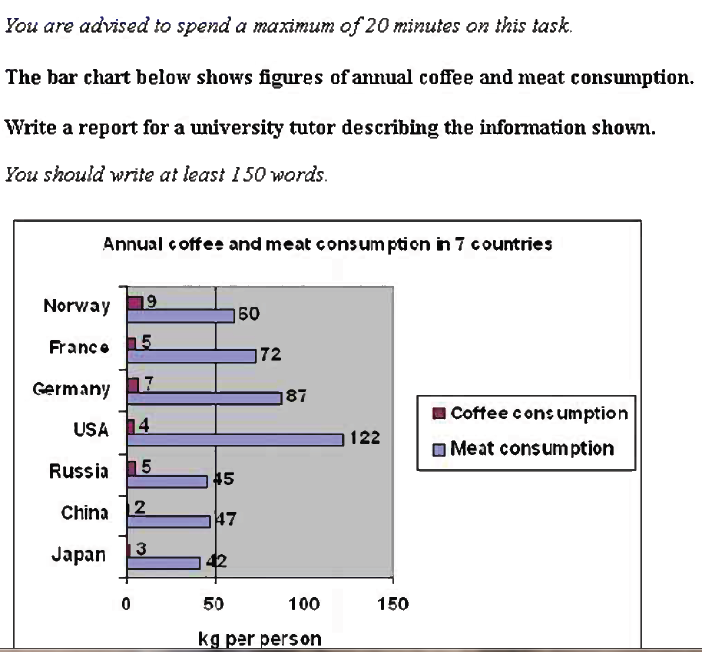
This is bar graph demonstrating yearly coffee and meat expenditure numbers as compared in 4 European, 2 Asian and 1 American countries. Meat consumption is in its maximum in USA, followed by European countries while Asian countries have the least rates. European countries are the most coffee consuming nations while Asians are also the least.
Meat consumption is in its top in USA (122 kg per human)then the number is significantly reduced to 87 when looking to Germany. Number of kilograms eaten by person are near in France (72) and Norway (60). Further significant drop is seen when looking at figures from China (47), Russia (45) and Japan (42).
Coffee consumption was greatly increased in Norway (9 kg per individual) followed by Germany (7) then other countries has approximate figures (5 for both France and Russia) followed by (4) for USA then (3) for Japan and the least coffee consumption is recorded in China with only two kilograms for each subject.

20140628_151129.pn.png
