Writing Feedback /
Illustration of the statistical information about the poor people in Australia in 1999 - IELTS Task1 [2]
Hello, everyone!
I am new to IELTS, and it's my first try on the writing IELTS Task 1.
I really appreciate for your help to improve my writing. Thanks a lot!!
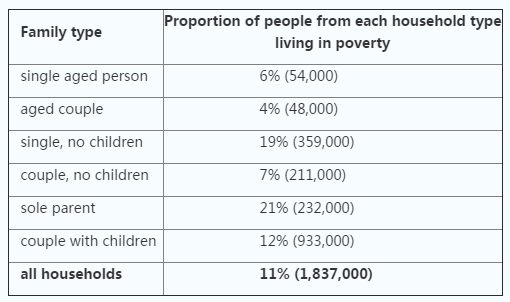
The table below shows the proportion of different categories of families living in poverty in Australia in 1999.
Summarize the information by selecting and reporting the main features, and make comparisons where relevant.The given table illustrated the statistical information of the poor in Australia in 1999. Distinguishing all the families into six types, the table provided the proportions and the amounts of the people living in poverty with respect to different types.
Firstly, the data of the amounts indicated the main and the tangential contributors. While there were 933,000 couples with children living in poverty, it was more than the double amount of the "single, no children" family, the second largest contributor. Furthermore, as the amount of the least significant contributor, aged couples, was 48,000, it was about one-twentieth of the largest one.
Secondly, the table afforded the proportions of each family type and of all households. As the proportion of the "sole parent" family living in poverty was 21 percent, higher than 11 percent, the rate of all the households, it was the highest rate among all the family types. What's more, as the proportion of aged couples in poverty was 4 percent, the minimum among all the categories, it was about one-fifth of the rate of the "sole parent" family.
Finally, relationships between the amounts and the rates alluded the relationships of the amounts between certain family types. The amount of the poor "single, no children" family was more than the amount of the poor "sole parent" family; however, the relationship of the rates of the above families was in reverse. Thus, there were more "sole parent" families than "single, no children" families at that time. Similarly, there were more "couple with children" families than the "single, no children" families.

IELTS_4_T1.png


