unbreakable
Apr 21, 2016
Writing Feedback / Describe charts which give information about two genres of TV programmes watched by men and women [4]
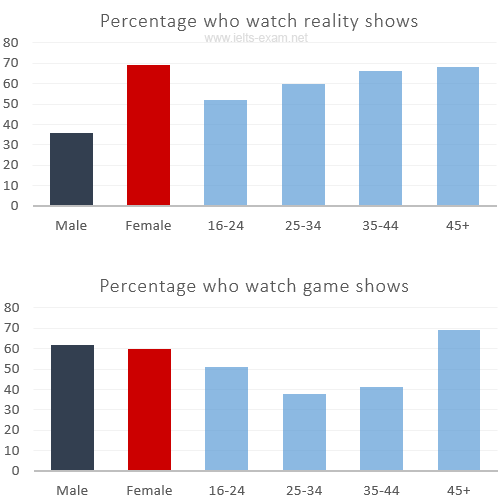
The bar graphs compare the proportions of male and female at four different age groups in Australia watching two types of TV programmes.
The most striking feature is that fewer males watching reality shows than femals, meanwhile, the number of males and female watching game shows are nearly the same. It is also noticeable that the higher age groups have the higher rates of people watching reality shows, compared to various change in the other.
There is a considerable number of women watching reality shows on TV, at 70 %, while the proportion of men only comprises one half. In terms of game shows, the figure for male increases significantly which is nearly equal with female ar around 60%
The youngest age group of the chart has the smallest number of people watching reality shows at over 50%. The figures for the next consecutive age groups grow gradually to 70% for the over 45s. However, the 16-24s and over 45s watching game shows figures reach a plateau, compared to the other. By contrast, the 25-34s and 35-45s fell sharply to about over 40%

IELTS_Writing_Task_1.png
