Prompt: The first chart below shows hoe energy is used in an average Australian household. The second chart shows the greenhouse gas emissions which result from this energy use. Summarize the information by selecting and reporting the main features, and make comparisons where relevant.
--------------------------------------------------------------------------------------------------------------------------------------------------------------------------------------
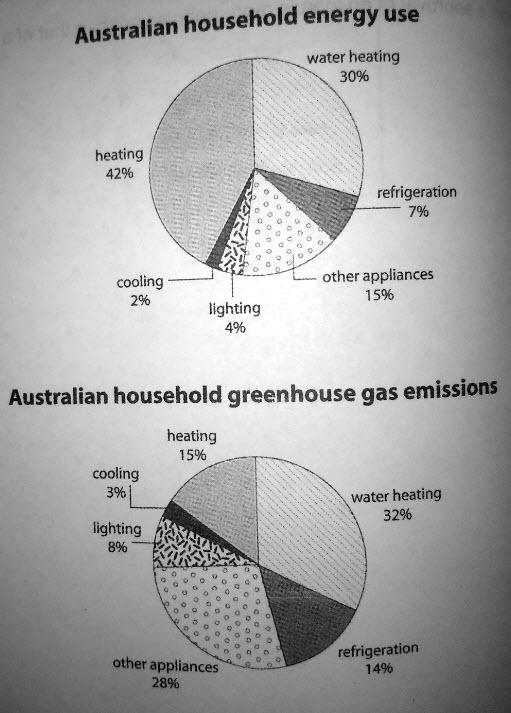
The pie charts illustrate the proportion of energy consumed by various appliances (water heater, heater, cooler, lights, refrigerator, and other appliances), and the greenhouse gases emitted by those appliances in an average Australian household.
Overall, the highest proportion (above 70%) of energy was consumed by heating devices (heater and water heater) and the lowest proportion of energy (6%) was consumed by lighting and cooling devices. Greenhouse gases emitted by water heater and other appliances together accounted for more than half of the total emissions.
In terms of energy used, two third of the total (75%) energy was used for heating purposes, in contrast to cooling and lighting, which only consumed 6% of the energy together. Energy consumed by refrigerator and other appliances were 7% and 15%, respectively.
With regard to greenhouse gas emissions, surprisingly, lights, refrigerators, and other appliances emitted twice the amount of the energy (8%, 14%, and 28%) they consumed. Greenhouse gases emitted by water heaters, heaters, and coolers comprised of other half (50%) of the total emissions.
--------------------------------------------------------------------------------------------------------------------------------------------------------------------------------------
No.of.words = 170.
--------------------------------------------------------------------------------------------------------------------------------------------------------------------------------------
The pie charts illustrate the proportion of energy consumed by various appliances (water heater, heater, cooler, lights, refrigerator, and other appliances), and the greenhouse gases emitted by those appliances in an average Australian household.
Overall, the highest proportion (above 70%) of energy was consumed by heating devices (heater and water heater) and the lowest proportion of energy (6%) was consumed by lighting and cooling devices. Greenhouse gases emitted by water heater and other appliances together accounted for more than half of the total emissions.
In terms of energy used, two third of the total (75%) energy was used for heating purposes, in contrast to cooling and lighting, which only consumed 6% of the energy together. Energy consumed by refrigerator and other appliances were 7% and 15%, respectively.
With regard to greenhouse gas emissions, surprisingly, lights, refrigerators, and other appliances emitted twice the amount of the energy (8%, 14%, and 28%) they consumed. Greenhouse gases emitted by water heaters, heaters, and coolers comprised of other half (50%) of the total emissions.
--------------------------------------------------------------------------------------------------------------------------------------------------------------------------------------
No.of.words = 170.

task1_20.jpg
