Please check my writing. Thank you very much. :D
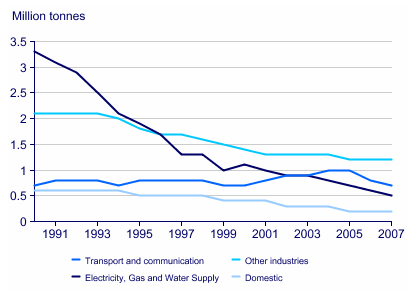
The graph below shows UK acid rain emissions, measured in millions of tonnes, from four different sectors between 1990 and 2007.
The graph illustrates the mount of acid rain emitted by some different fields over 17 years period.
There were a dramatic change of the number of acid rain emissions in group 1 including Electricity, Gas and Water Supply, and Domestic and Other industries while Group 2 including Transport and communication was much slighter.
The amount of acid rain emitted of Electricity, Gas and Water supply in 1991 was around 3.3 million tones, following by Other industries and Transport and communication and Domestic with 2.1 million tones, 0.8 million tones and 0.6 million tones, respectively. The number of acid rain emissions of Electricity, Gas and Water supply had declined considerably to 1 million tons in 1999 before increased slightly in the 1999-2001 period. However, it still significantly decreased thereafter to 0.5 million tons in 2007. The trend of the number of acid rain emitted of others in Group 1 was the same as the Electricity, Gas and Water with around 1.5 million tones in Other industries and 0.2 in Domestic.
The number of acid rain emissions of Group 2 was similar in 1999 and 2007 with 0.8 million tones.
188 words. Is this OK?

Task_1_Acid_rain_em.png
