Writing task 1: the consumption of fish and some different kinds of meat
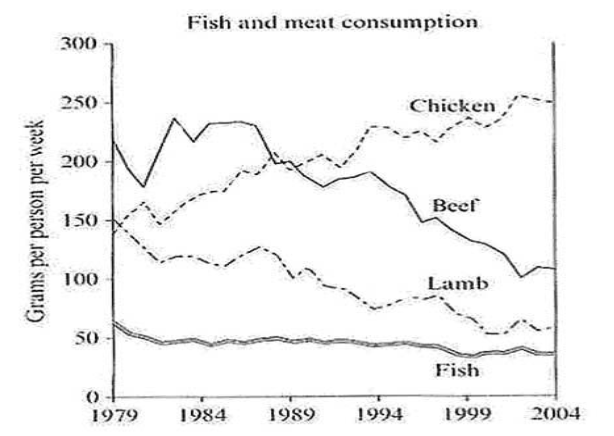
The graph below shows the consumption of fish and some different kinds of meat in a European country between 1979 and 2004.
Answer:
The line graph provides the amount of four different kinds of food used by people in a European nation from 1979 to 2004.
Overall, it is clear that beef, lamb and fish decreased in consumption, while there was a fluctuating growth in the figure for chicken. In addition, fish was the least commonly food in the Europe throughout the period shown.
At the start of period, the expenditure of beef was the highest value which over 200 grams. The amount of chicken and lamb was lower, by below 150 grams compares with exactly 150 grams, respectively. However, fish was the lowest product that eaten by roughly 60 grams per person per week.
In the 1979-2004 period, the country used a significantly increase of chicken, approximately 250 grams. Whereas, only over 60 grams of lamb and 50 grams of fish were eaten in 2004. After many fluctuations, beef reached the highest point of the whole graph by above 240 grams in 1984, before dropping gradually to 100 grams at the final figure.

Capture.PNG
