Unanswered [1]
  

Home / Writing Feedback   % width   Posts: 3


The bar chart compares the percentage of Bulgarians categorized three sorts of education backgrounds


Muhammadyusuf 7 / 13  
Sep 10, 2015   #1
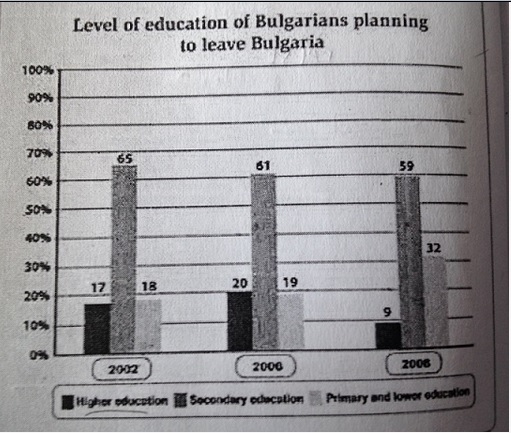
The bar chart compares the percentage of Bulgarians categorized three sorts of education backgrounds which planned to leave Bulgaria between 2002 and 2008. Overall, it can be seen that the figure of people with secondary education which wanted to stay and visit abroad was higher than another education degree.

Based on the graph, standing at 65 per cent, secondary education presented as the highest percentage of the Bulgarians in 2002. Then, it was a gradual decrease by 4 per cent in next four-year period. At the end of the year, this rate, again went down to 59%. Above all, even though the secondary education decreased gradually, it still became higher percentage than another educational level.

Next, two of the categories rose steadily in 2006, by higher education to a fifth per cent and primary and lower education to 19%. Moreover, over the following period, while primary and lower education grew significantly, higher education witnessed a dramatic drop at least one in ten per cent over the following period.

  • TASK 1


lcturn87 - / 423  
Sep 10, 2015   #2
I can help provide feedback for your summary.

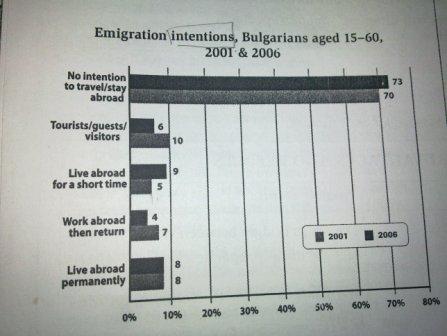
In your first paragraph, you discuss education backgrounds and the years 2002-2008. This bar chart discusses traveling abroad and it states 2001-2006. This could be the wrong bar chart that was posted. I think you want feedback regarding another bar chart.

I can help you with some grammar mistakes in your writing, but you could still post the correct bar chart.

1st paragraph: You could state:" The bar chart compares the educational backgrounds and percentage of Bulgarians who planned to leave Bulgaria between 2002 and 2008." The next sentence change the word figure to "number". Add a comma after the word education and abroad.

2nd paragraph:"...standing at 65 percent..." You could change "percent" by making it one word throughout your paper or use (%). The last sentence "...it still was a higher percentage..." Remember to use the past tense since the years were in the past.
shintacandrade 10 / 66  
Sep 11, 2015   #3
As I have the information you mean, I upload the correct picture here.

Furthermore, my suggestion is that you should write the main body paragraphs by using words such as however, while, although, or so on to compare and to make contrasts any trends that exist in the data. Let me give a try for this part:

Next, two of the categories rose steadily in 2006, by higher education ...

However, the figures in the remaining two categories changed significantly. The overall percentage of people with primary or lower education showed a sharp rise from 18% in 2002 to 32% in 2008 despite the fact that this rose by 1% in 2006. In contrast, there was a considerable decrease in the percentage of people who had received higher education. Even though this figure increased slightly to a fifth in 2006, but then it fell very dramatically to 9% in 2008 (declined by more than half).

Hope this helps ~ Shinta


  • 256030_1_o.jpg


Home / Writing Feedback / The bar chart compares the percentage of Bulgarians categorized three sorts of education backgrounds
ⓘ Need Writing or Editing Help?
Fill out one of these forms for professional help:

Best Writing Service:
CustomPapers form ◳

Graduate Writing / Editing:
GraduateWriter form ◳

Excellence in Editing:
Rose Editing ◳

AI-Paper Rewriting:
Robot Rewrite ◳