usa marriages and divorces rates
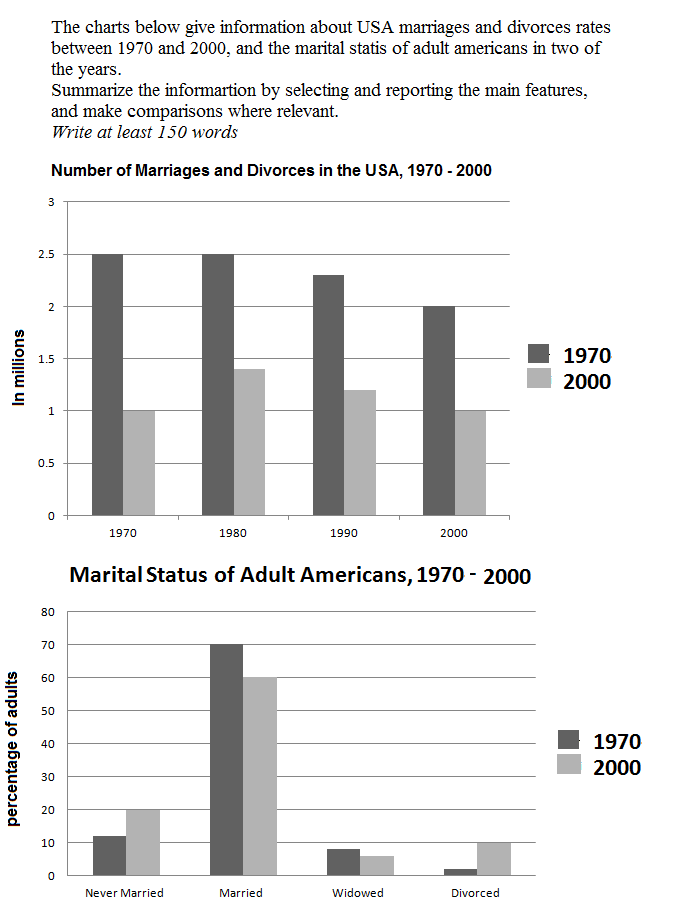
The first bar chart shows changes in the number of marriages and divorces in the USA while the second bar chart describes the marital status of American adults between 1970 and 2000.
Overall, there were more marriages than divorces during the research period in the top chart. In the bottom chart, most people were married in both years, but the figure for single grown-ups was higher in 2000.
In 1970, 2.5 million and 1 million people were married and divorced, respectively. The number of married people remained stable a decade later before hitting a low of 2 million in 2000. In contrast, the divorce rate peaked in 1980, at roughly 1.5 million but decreased to precisely 1 million in the last year.
The percentage of married adults accounted for 70% in 1970 compared to 60% in 2000. This figure is followed by a group of unmarried people, with 20% in 1970 and around 10% in 2000. As for the widowed and divorced, the proportions remained below 10% in both years.
(170 words)

Thechartsbelowgiv.png
