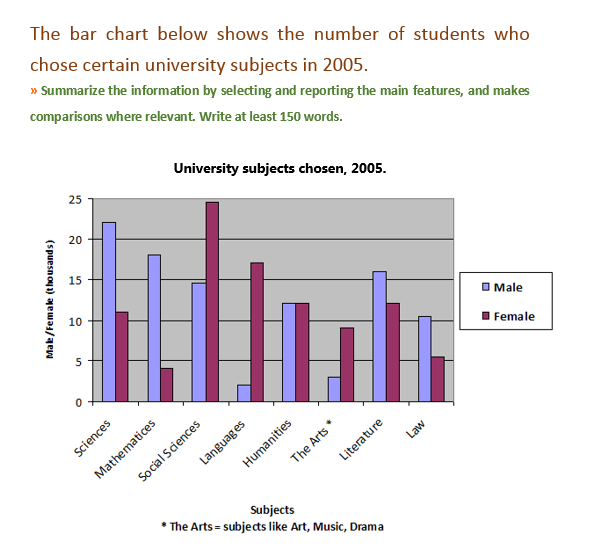
The bar chart below shows the numbers of students who chose certain university subjects in 2005
Summarise the information by selecting and reporting the main features, and make comparisons where relevant.
ANSWER:
This bar graph illustrates that various subjects in university which were selected by undergraduates in 2005.
Overall, Science and Mathematics were favorite subjects of male students in 2005. By contrast, female chose less technical subjects so Social sciences and Languages were the most popular among female students.
According to the graph, the number of male students with choosing figures ranged from the highest number of just over 20 thousand to the lowest number of about 2 thousand, a difference of around 18 thousand. Science, Math and Literature were their favorite subjects.
Social sciences and Languages were chosen by female the best with the figures nearly 25 thousand and under 20 thousand. This two subjects had more female choosing figures than male students. The other subjects such as Science, Math, Literature and Law, women selected them lower than men. For Humanities, both the number of male and female were the same, just over 10 thousand.
(154 words)

chuabaiieltswriti.png
