Unanswered [4] | Urgent [0]
  

Home / Writing Feedback   % width   Posts: 2


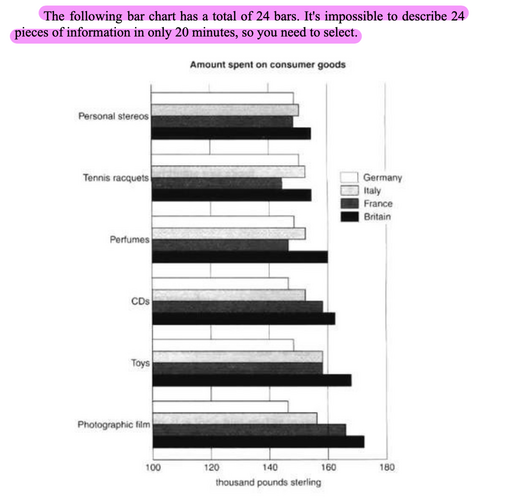
The bar charts below illustrate the money that consumers spend in six different categories


bazhoaxanh 1 / -  
Mar 25, 2023   #1

The chart below give information the amount spent on customer goods


The bar charts below illustrate the money that consumers spend in six different categories in four distinct countries, namely Germany, Italy, France and Britain.
It is clear that six categories of goods were highly spent in Britain, whereas France had the lowest spending on the first three kinds of goods and the lowest spending on the rest of these belonged to Germany.

Looking at the first three kinds of goods, all countries spent under or equal to $160.000. However, while Britain spent around 155.000$, Germany, Italy and France consumers used about 145.000$ to purchase these products. As a result, the countries that had the amount spent on customers listed from the lowest to the highest were France, Germany, Italy and Britain.

In contrast to the first three ones, under 180.000$ was spent on the rest. The list from the lowest country to the highest one was Germany, Italy, France and Britain. While Germany spend approximately 145.000$ on CDs, Toys and Photographic film, all of the other countries spend over 150.00$ on these.

  • rsz_screenshot_2023.png


Holt  Educational Consultant - / 15347  
Mar 26, 2023   #2
The summary overview does not summarize any information of value to the examiner. What were the 6 areas referenced? Indicate all 4 countries rather than just 3. The incomplete listing negatively affects the short discussion form. There is a lack of proper short listing of information based on the provided image. By the way, the writer shows a problem with his singular v. plural wording. Only one, a single bar chart was provided but he referenced it in plural form in his sentence presentation. 2 sections of scoring will be affected by this mistake. The C+C and GRA sections will receive preliminary score deductions for this paragraph presentation. The problem with information source referencing in the report is what severely affected the presentation in terms of scoring requirements. While the essay tries to be informative, it will not receive a passing score since the writer did not accurately represent the sections required for the analysis and information presentation.


Home / Writing Feedback / The bar charts below illustrate the money that consumers spend in six different categories
Do You Need
Academic Writing
or Editing Help?
Need professional help with your assignments? Fill out one of these forms:

Graduate Writing / Editing:
GraduateWriter form ◳

Best Essay Service:
CustomPapers form ◳

Excellence in Editing:
Rose Editing ◳

AI-Paper Rewriting:
Robot Rewrite ◳