IELTS Writing Task 1: Bar chart - global sales
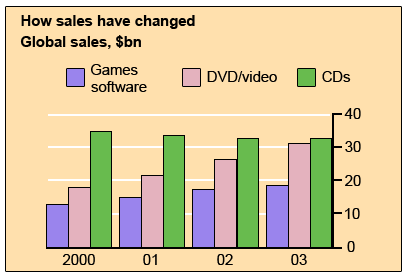
The chart below gives information about global sales of games software, CDs and DVD or video.
The bar graph illustrates the change of sales of 3 entertainment categories worldwide in billion dollars from 2000 to 2003.
Overall, it is obvious that all three types fluctuated over the period. Both games software and DVD/video saw an upward trend while the opposite was true for CDs.
In 2000, the sales of games software were about 15 billion dollars, whereas the DVD/video's was about 19 billion dollars. Both were progressively increased over 3 years with the domination of DVD/video over games software over 3 years before standing at slightly over 30 billion dollars and approximately 19 billion dollars in 2003 as the aforementioned order.
Starting at around 35 billion dollars, the sales of CDs dropped gradually at the beginning of the period, down to over 30 billion dollars in 2002 before stabilizing for a year.
Thank you for the feedback!

Capture.PNG
