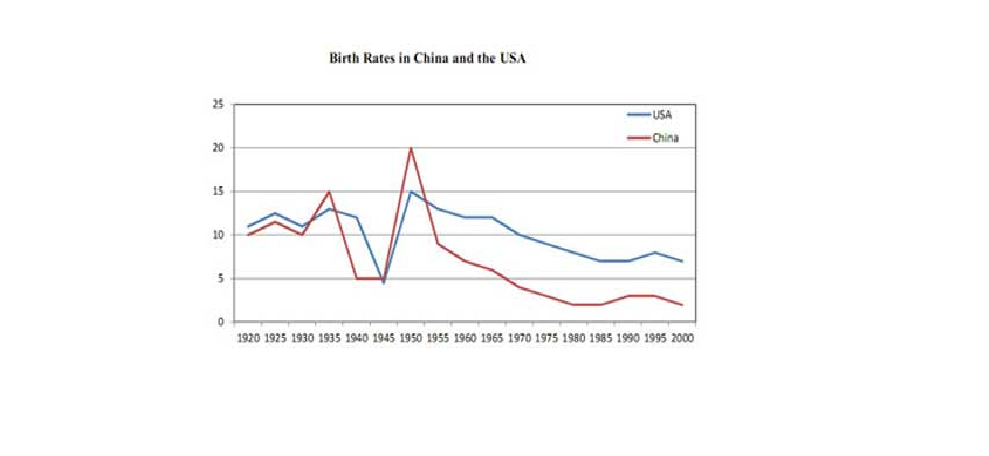
The two graphs provide information changes in the birth rates of China and the USA between 1920 and 2000.
In general, it can be seen that the graphs show comparison percentage of birth rates in two countries during seventy years.
In the first graph, in 1920, birth rates in China had percentage approximately 10, and climbed slightly about 12 in 1925. Afterwards, it decreased to back same as in year 1920, however, it began to increase in year 1935 approximately 15. In contrast, it began to fall sharply from year 1940 to 1945 approximately 5, and it rose sharply in 1950 about 20. Next, it continued to fall sharply in year 1955, and it decreased step by step from 1995 to 2000.
In the second graph, in in 1920, birth rates in US had percentage approximately 12, and climbed slightly about 13 in 1925. Then, it decreased to back same as in year 1920, however, it began to increase steadily in year 1935 approximately 13,5. In contrast, it began to fall sharply in year 1945 less than approximately 5.1, and it rose sharply in 1950 approximately 15. Next, it continued to fall sharply in year 1955, and it began to fall step by step from 1995 to 2000.
To sum up, it can be conclude that both US and China undergone to be fluctuated. Next, Birth rates had increased sharply between US and China less than approximately 15-20, and US and Chine decreased to fall sharply from 1995 to 2000.

birth_rates_in_china.png
