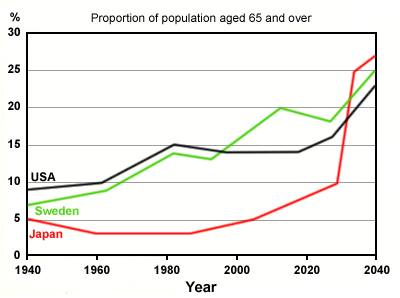
The graph below shows the proportion of the population aged 65 and over between 1940 and 2040 in three different countries.
Summarise the information by selecting and reporting the main features, and make comparisons where relevant.
A breakdown of the percentage inhabitant aged 65 and more in USA, Sweden, and Japan since 1940 and is predicted until 2040, is illustrated in the line chart. At first glance, there were three different trends in the proportion of population among three different countries. While the USA and Sweden show the fluctuation trend, Japan shows extremely increase in the future.
Moving to a more detailed analysis, standing at 9%, USA held the dominance in the first period in 1940, which was followed by both Sweden (7%) and Japan (5%) at the second and third. During 1940 to 1980, USA and Sweden experienced an increase and declined slightly over the following year in 1990. However, a slight decrease is witnessed by Japan in the early and remained stable over the same period.
Turning to the next analysis, a significant rise was presented by Sweden through USA over a 10-year period from 1990 to 2010, rose to a fifth (20%), and is projected experiencing a increase of a quarter (25%) in 2040 when in the same period, USA remained unchanged prior to being predicted rise significantly in 2040, at 23 percent. Interestingly, Japan, as the lowest during the early and middle period, is projected witnessing an extreme increase and peaks at 27% in 2040.

the_proportion_of_th.jpg
