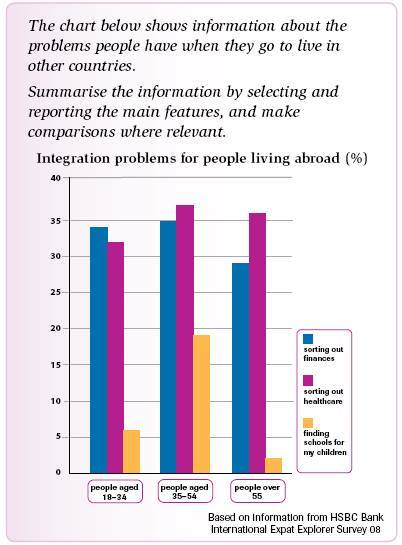
A breakdown of the various difficulties that citizens have when they live in a novel country regarding to three different age groups and measured in percentage is illustrated in a bar chart. At first glance it is evident that the problems are faced by majority people aged 35-54 which sorting out healthcare is the most complicated problem.
The essential problem for residents are sorting out healthcare. There is a small gap between people aged 35-54 and over 55 who find healthcare as a problem in their life, by 2%. In contrast, just a few youngest group (18-34 years) experience this problem, at 32%. Another crucial problem for people in the middle group (35-54) is financial, over a third of the total. Likewise, the young people aged 18-34 shows 33%. In this case, the proportion of older age group is the smallest number, at 28%.
Turning to the less important difficulties, finding schools for children. People over 55 years find this easier, a very small number, at about 2%. The youngest group provides three times more of the total than older group. However, middle age group still has the biggest percentage, approximately 20%.

barchart.jpg
