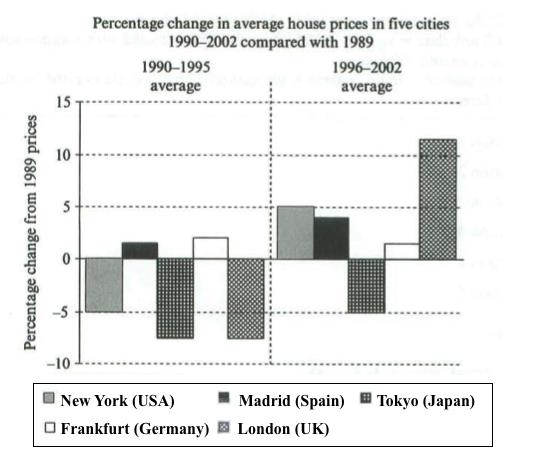
A breakdown of the proportion of cost house in five different countries from 1990 to 20012, a 13-year period is illustrated in bar chart. Overall, it can be seen that London saw the greatest changes in house prices. In any case, while most of nations experienced increasing prices, the figure for Japan's house price fell.
Between 1990 and 1995, the average of house cost in Japan and London had similar rates by around 7%, compared with 5% for New York house prices as the lowest percentage. In contrast, prices increased by under 2% in Madrid and 5% in Frankfurt as the highest proportion over the year.
Over the following five years period, the proportion of house prices rose significantly in all of countries, with an exception in Japan. London house prices witnessed a dramatic increased to 12% which was the largest rates over the period. As the same way, in New York saw a upward trend on homebuyerS to 5%, and to 4% on Madrid house prices. However, Tokyo remained the cheapest on house cost, representing at -5%.

hOUSE.jpg
