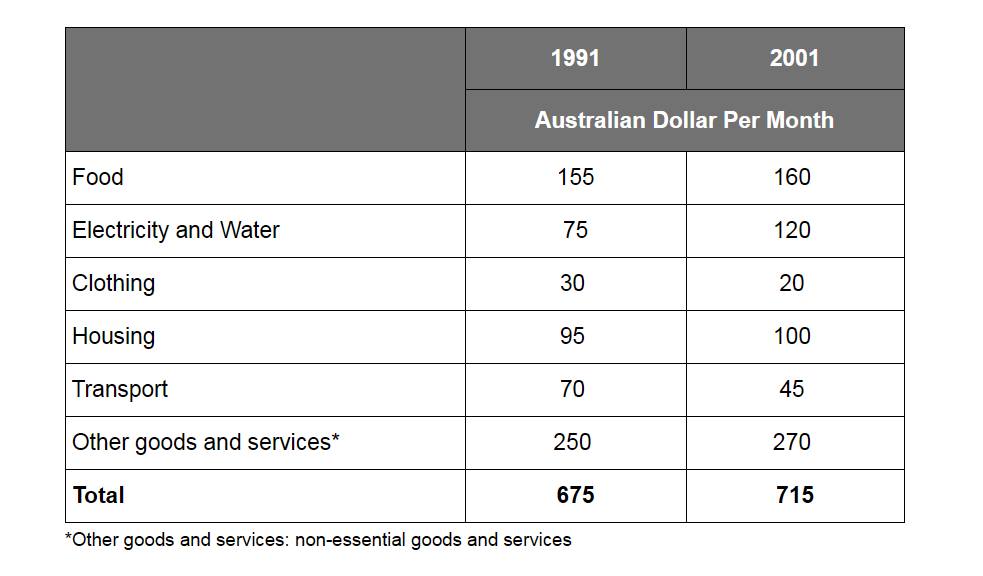
The table below shows the monthly expenditure of an average Australian family in 1991 and 2001. Summarise the information by selecting and reporting the main features, and make comparisons where relevant.
The table gives information about changes in expense of an average Australian family between 1991 and 2001, and is measured in US dollars. Overall, it can be seen that the spending of an average Australian family was higher in 2001 than 1991, 715 and 675 per month respectively.
In 1991, the expenditure on non-essential goods and services was 250 which was highest among the given category. This reached to 270 in 2001 which was also the highest amount among the given expense categories in 2001. While the amount of expenditure in electricity and water saw a dramatic increase over the ten year period from 75 to 120. At the same time, the amount of money spent in characterized food and housing with minor increases both 5 and non-essential goods and services expenditures about 20.
However, some categories decreased in the period considered. This is the case of clothing expenses fell from 30 to 20. And transport budget was dropped of almost 30, from 70 in 1991 to 45 in 2001. Following this, it can be seen that food and other goods and services were the two biggest items of expenditure.

12891676_10204370101.jpg
