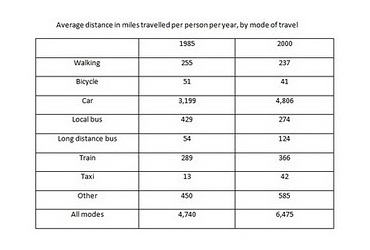
The table below gives information about changes in modes of travel in England between 1985 and 2000. Summarise the information by selecting and reporting the main features, and make comparison where relevant.
==========================================
The table presents the data concerning the alteration in various means of transport in UK during a particular year from 1985 to 2000.
Overall, the overall average distance travelled by all transportation types increased markedly while car stance as the most popular vehicles using by England people in the given period.
As per information, English's people travelled by car which reckoned for over 300 miles per person per annum in 1985, the number then rose sharply to the average 4800 miles in the following 15 years. Capturing an average increase by 77 miles, train coming second popularity. Similarly, in terms of long distances gained by bus and taxi depicted in increase to nearly threefold each during the statistics. However, a rose by more than a hundred miles showed in the other mode of transportation un-mentioning specifically in the tables.
Striking contrast, local bus using fell from 429 miles in 1985 to 274 miles in 2000, noted as the greatest degradation. Also, in year 2000, the average people walked and cycled less than that of the formerly did in the beginning, reaching 237 miles and 41 miles respectively.

table_average_distan.jpg
