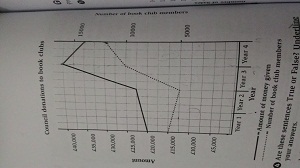
The line graph gives information about the amount of money which city council give to book clubs over a four-year period. Overall, it can be seen obviously that the both of lines experienced an upward trends and the amount of money was always higher than the number of books.
Looking at the details, in the first two years, the amount of money had a slight incline while the number of books showed a slow decline. In the third year, the two of lines experienced a sharp increased and the amount of money reached a peak at 40,000 euro with 14,000 books. In the last year, the charity went down gradually while the books went up steadily and reached the peak at 30,000 euro with 12,000 books.
The money had highest number in the third year while the books showed a least number in the second year. Although the money rose, the books was not always increased.

P_20160822_210449.jp.jpg
