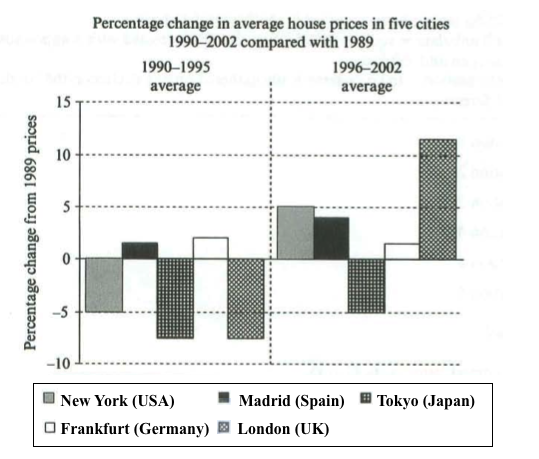
The bar chart illustrates average house prices changes described in percentage from five modern cites worldwide over two periods, 1990-1995 and 1996-2002, based on their house prices in 1989.
As we can see from the chart that the most significant changes occurred in New York and London. More specifically, the average percentage change in New York jumped from -5% to 5% over the two periods; in the meanwhile, in London, the average percentage had a dramatic increase from lower than -5% to above 10%.
It also can be observed from the chart that the average house prices modestly increased in Madrid and Tokyo. For instances, the average price of houses in Madrid increased approximately 2% over the two periods, while Tokyo had the similar percentage increase yet its average percentage change was still negative from 1989.
One last thing should be mentioned is that Frankfurt was the only city that had a percentage decrease in the record over the two periods amongst the five cities. Nevertheless, the change was minor with around merely 1% decline.
Overall, the bar chart demonstrates that although the average house price in Frankfurt dropped from 1990 to 2002, it had different levels of increases in most modern cities.
This is actually my first post on this forum. I'm glad to receive any of your feedback!
Also, this writing task requires only 150 words but this essay is above that limit. Are there any suggestions to reduce the words?
Thank you very much!

House_price.png
