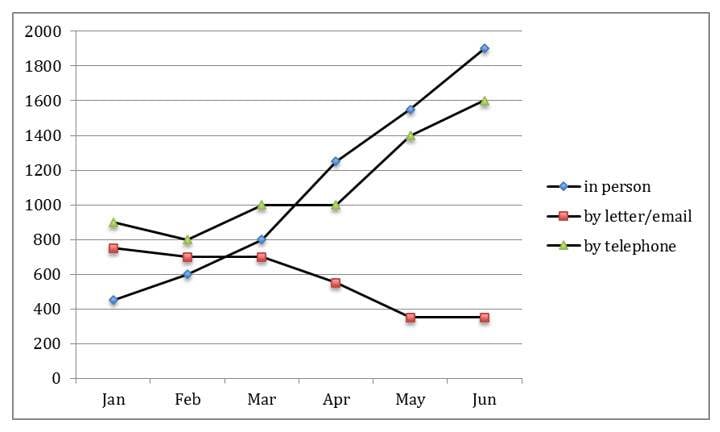
information at a tourist office in the UK
The chart illustrates how many inquiries were received at a tourist office in the UK over a half-year period.
Overall, the quantity of letter/email requests witnessed a downward trend, while the opposite was true for the other counterparts. Most strikingly, the figure for in-person information request was the lowest before surpassing the number of people asking for information by letter/email, telephone and becoming the highest.
As can be seen clearly, in January, the data of in-person questions started at slightly above 400, which was a nadir of the other categories. The figure increased dramatically from approximately 400 to nearly 1200 over next 3 months, then continued its upward trend to an extraordinary peak of roughly 1900 at the end of the period. Likewise, the figure of telephone information inquiries, which started higher than in-person requests roughly 300, slightly went up to 1000 in April and ended at 1600 in June.
In contrast, telephone questions experienced an downward trend, starting the period at under 800, tremondously declined at nearly 600 in April and hit the lowest point of roughly 400.

2172022104353A.jpg
