Report the main features and make comparisons
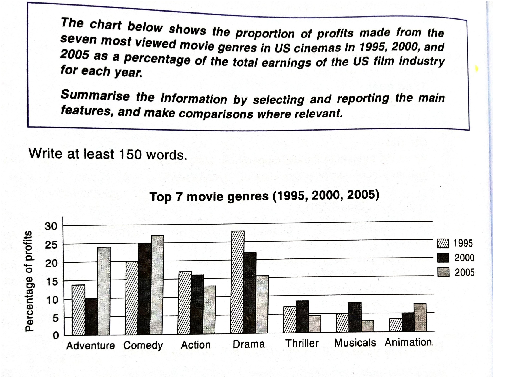
The bar chart illustrates the percentage of profits made from seven most popular kinds of movies in US cinemas in 3 different years: 1995, 2000 and 2005 as the proportion of total ernings of American film industry.
Overall, it appears that the profits came from seven genres of movies fluctuated, but adventure and drama seemed to experience many changes. Moreover, adventure, comedy, action and drama generated more profits than other genres.
Looking at the graph more closely, one can see that in 1995 drama was the most lucrative kind of movie, accounted for one-third of the total earnings. Drama was followed by comedy, which generated 20 percent. Action was also favorite, which represented for roughly 17 percent. Ranked in the fourth place was adventure, which captured for about one-five of total. The figures for thriller, musicals and animation were considerably lower, accounting for about 7 percent, 5 percent and 3 percent. In 2000, comedy became the most profitable genre of music, surging significantly to 25 percent. The upward trend can be also seenin thriller, musicals and animation. By contrast, the percentages of profits came from adventure, action and drama started to decrease to 10 percent, 16 percent and 23 percent.
At the last stage of the period, the proportion of profits made from comedy remained highest among 7 genres, increasing to 27 percent. A similar pattern can be seen in adventure and animation. One of which experienced the largest change, growing dramatically to almost 25 percent. Meanwhile, the figures for other genres such as action, drama, thriller and musicals all declined.
(261 words)

Untitled.png
