export earnings (2015-2016)
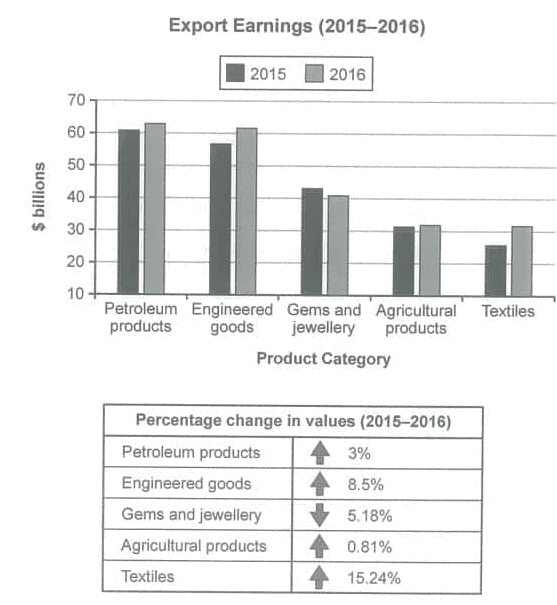
The bar chart illustrates the export earnings of the USA from five different products. The table below shows the percentage change in values for five different products.
Generally speaking, except for the case of gems and jewelry and agricultural products, all the surveyed categories experienced an upswing trend in their export values from 2015 to 2016. Additionally, the figure for textiles observed the most dramatic change throughout the examined period.
Between 2015 and 2016, petroleum product export earnings increased by 3%, from $60 billion to more than $63 billion, while agricultural product export earnings remained relatively stable. By contrast, the figure for gems and jewelry started at about $40B, but later it witnessed a fall of 5.18% in 2016.
In 2015, the export value of engineered goods was around $57 billion, rising to more than $60 billion in 2016. Such a growth rate, however, was even more pronounced in the case of textiles, with a sharp increase of 15.24%, from more than $25 billion to around $31 billion in just one year of the examined period.

task1test2cam14.png
