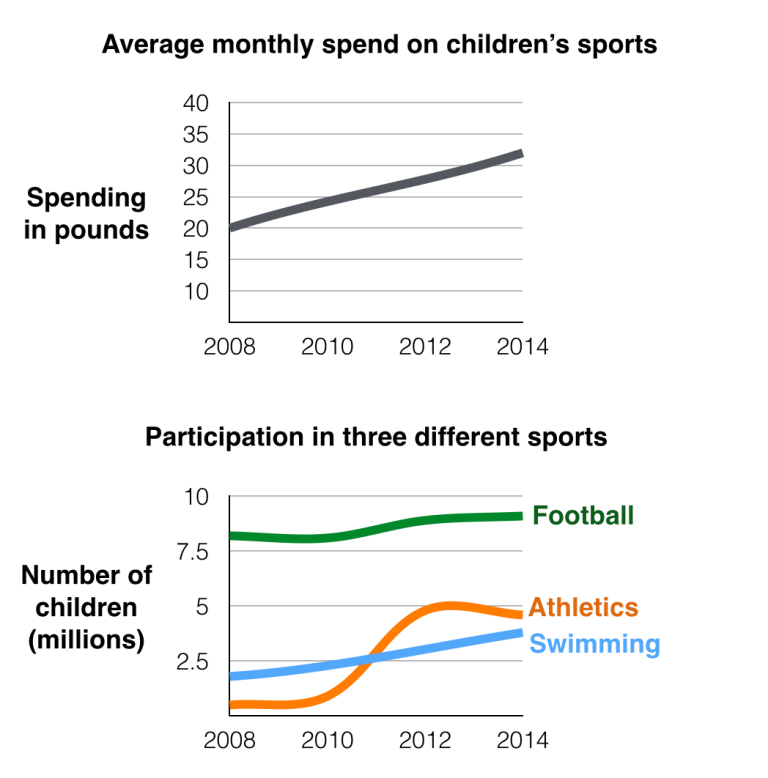
The graphs above give information about the money spent per month by British parents on their children's sports between 2008 and 2014. The second chart shows the number of children who participated in three sports in Britain over the same time period.
The average amount of money that British parents expended monthly on their progeny's sports in a seven-year period is revealed by the first given graph while the second supplied chart gives data on how much children took part in football, athletics and swimming from 2008 to 2014.
At the first glance, it is clear that the charge invested in children's sport increased steadily each year as well as the growth of participants in three common sports.
In 2008, the levels on spending on children's sport activities stood at 20 pounds, after that this figure rose significantly over the rest six years and peaked at roughly 33 pounds in the year 2014.
Turning to participation levels, football had drawn by far the largest attention during the period, specifically the quantity of participants was approximately 8 millions in 2008 and then went up to 9 millions in the last year. Although swimming experienced a same trend, the figure for this sport was much lower with 2 millions children participated in 2008 but then rose gradually at 3.5 millions in the year 2014. Finally, the number of kids joining athlentics leveled off at 1 millions over the first two-year period, nevertheless the amount of athlete witnessed a remarkable leap from 1 to 5 millions between 2010 and 2012 then declined slightly by 0.3 millions in 2014.
Write a report of at least 150 words reporting the main features and making comparisons where relevant.
The average amount of money that British parents expended monthly on their progeny's sports in a seven-year period is revealed by the first given graph while the second supplied chart gives data on how much children took part in football, athletics and swimming from 2008 to 2014.
At the first glance, it is clear that the charge invested in children's sport increased steadily each year as well as the growth of participants in three common sports.
In 2008, the levels on spending on children's sport activities stood at 20 pounds, after that this figure rose significantly over the rest six years and peaked at roughly 33 pounds in the year 2014.
Turning to participation levels, football had drawn by far the largest attention during the period, specifically the quantity of participants was approximately 8 millions in 2008 and then went up to 9 millions in the last year. Although swimming experienced a same trend, the figure for this sport was much lower with 2 millions children participated in 2008 but then rose gradually at 3.5 millions in the year 2014. Finally, the number of kids joining athlentics leveled off at 1 millions over the first two-year period, nevertheless the amount of athlete witnessed a remarkable leap from 1 to 5 millions between 2010 and 2012 then declined slightly by 0.3 millions in 2014.

linegraphchildrens.png
