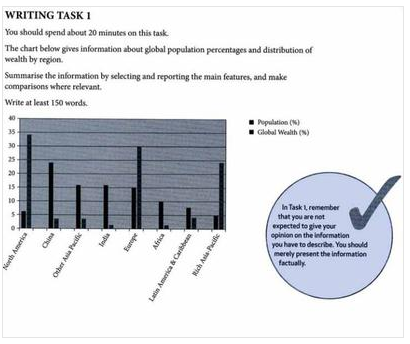
The bar graph compares the population of world and the the method where wealth is distributed in different regions across continent around the world. Overall, the world population statistics are inversely proportion to wealth distribution. I any case, china has the gratest number of pupulation while nort america is the rishest country
A closer to look the data, the proportion of North America has the largest percentage of global wealth, just approximately under 35%. Nonethelss, this figure is actually about seven times lower compared to its population. Similar trend is experienced to Europe and most of the rich countries in Asia-Pacific, with 15% and 5% of inhabiant respectively,.
Apart from previous discussion, there are a number of inhabitant is higher than budget such as China, India, Africa, Latin America and the Caribbean, and other areas in Asia-Pacific. The highest point is China has the highest percentage of people, accounting for about 25% of world's population, but only 4% of total wealth. This also happens in India, with over 15% of the global population, but only 1% of wealth.

task_1.PNG
