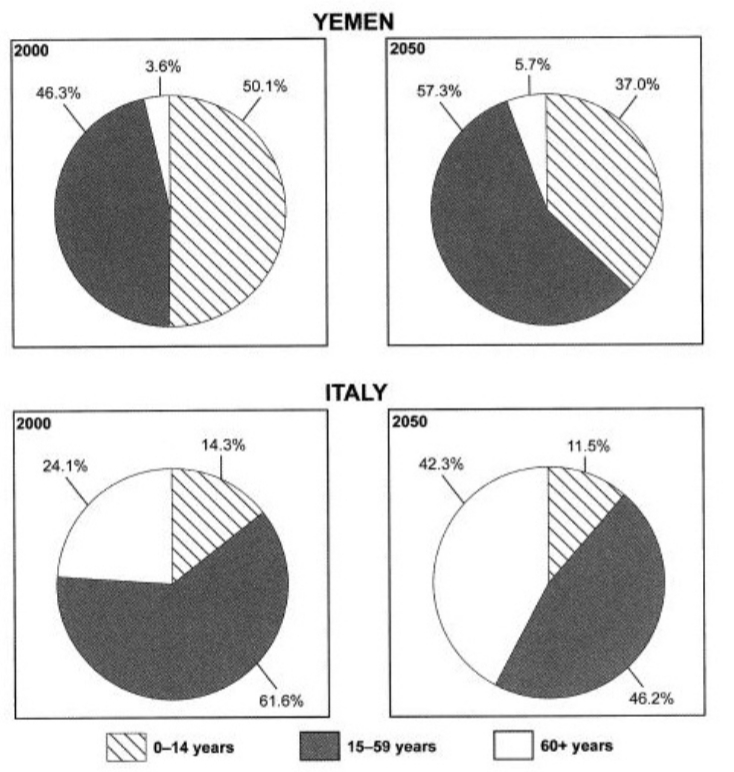
Age Structure in two different countries
The charts below give information on the ages of the populations of Yemen and Italy in 2000 and projections for 2050.
Summarise the information by selecting and reporting the main features, and make comparison where relevant.
Here I have a question:
May I rephrase "aged 0 to 15" into " teenagers"
"aged 15 to 59" into "adults" and "aged 60+" into "elderly"?
The pie charts illustrate the total amount of all ages citizens between Yemen and Italy in 2000 and the comparison of projections for 2050.
Overall, it is exceedingly evident that the group of adults from aged 15 to 59 accounted for the majority proportion not only in populations but also projections in both countries. However, the age from 60 plus stood at the least percentage in population and projection of Yemen while the aged from 0 to 14 occupied the least ratio in population and projection of Italy in 2000 and 2050,respectively.
Taking a closer look, the differentiation of percentage between 15 to 59 years old of populations and projections in Yemen and Italy are quite slight in 2000 and 2050. Only 15.3% and 11.1%, respectively. In addition, the group of aged 60 plus accounted for almost half of pie chart of projections in Italy while it stood at the least in Yemen. There is 36.6% differentiation between both countries.

20191122_013349.jpg
