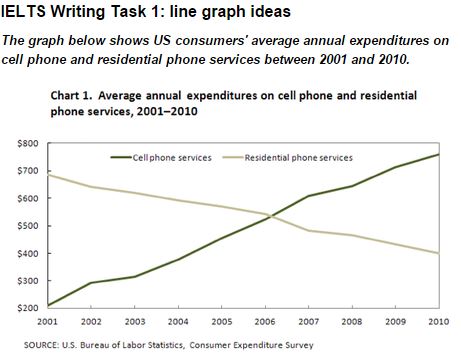
A comparison of the trade in two kinds of phone product, namely mobile and residential one in a nine-year period from 2001 to 2010 in the US and this is presented by the a line chart. Overall, it is noticeable that the amount of money which spend for cell phones always increase every year, while another for landline phone experienced conversely.
There were significant changes between selling both commodities. In the beginning year, the price of cell phone stood at $200 and for home phone is more than threefold in $700. But then, the rate of hand-phone noticed a dramatic increase to $300, while the value of house-phone showed a dramatic fall by $80. This condition lasted for a four-year later.
Moving to a more detailed analysis, the line chart described the interesting trend in last five-year period. This is because the lines intersected in 2006, exactly in $550, but the trend of residential telephone described a worse trend since the rise number of users in cell phone. Then, over following the four years later, both lines showed the slight movement until the expense of mobile phone reached a peak at $750 and the price of landline ring dropped to $400.

annual_expenditures_.jpg
