"Hello, this is the first time I join our forum, thanks for your all supports and advises. I would be grateful if you mark my essay"
Here is my essay:
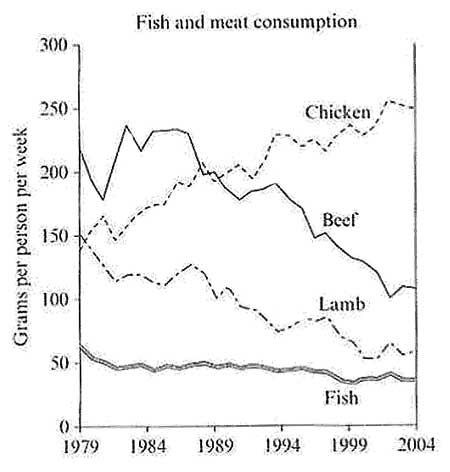
The give line chart illustrates the figure for food consumption including four main categories measured in a European country from 1979 to 2004
It can clearly be seen that there was an opposite trend in the consumption of different foods over the 25-year period. In particular, chicken saw a steady increase while beef and lamb show a downward movement.
According to the given information, in 1979 the amount of chicken usage accounted for around 200 gram per week while only 50 gram of fish was eaten. At the same time, there was a similar pattern of eating beef and lamb, approximately 150 gram per week. In the next 10 years, Lamp consumption witnessed a significant decline from 150 to just over 100 gram per week whereas chicken and beef had a fairly equal quantity, stood at 200 gram.
It was not until 2004 that chicken experienced the highest figure, roughly 250 gram per week, which was at least twice as high as that for beef. Interestingly, the number of fish consumption showed a downward fluctuation around 50 gram per week over the whole period
Here is my essay:
figure for food consumption somewhere in Europe
The give line chart illustrates the figure for food consumption including four main categories measured in a European country from 1979 to 2004
It can clearly be seen that there was an opposite trend in the consumption of different foods over the 25-year period. In particular, chicken saw a steady increase while beef and lamb show a downward movement.
According to the given information, in 1979 the amount of chicken usage accounted for around 200 gram per week while only 50 gram of fish was eaten. At the same time, there was a similar pattern of eating beef and lamb, approximately 150 gram per week. In the next 10 years, Lamp consumption witnessed a significant decline from 150 to just over 100 gram per week whereas chicken and beef had a fairly equal quantity, stood at 200 gram.
It was not until 2004 that chicken experienced the highest figure, roughly 250 gram per week, which was at least twice as high as that for beef. Interestingly, the number of fish consumption showed a downward fluctuation around 50 gram per week over the whole period

graphfishmeatcons.jpg
