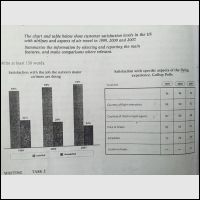
The chart and table highlight the percentage of customer satisfaction quality and specific aspect of flying experience with airlines in the United States in 1999, 2000 and 2007. Overall, satisfied steadily increase, but dissatisfied had declined over period given. Courtesy of flight attendants, courtesy of check in/gate agent and schedules become a majority, which is courtesy of the flight attendants had the highest percentage. Price of tickets and comfort of seats into a minority of enthusiast.
Moving to a more detail analysis, satisfied of job nation's major had increased steadily, approximately 65%, 69% and 72% over period given. The amount of dissatisfied had decreased slowly, roughly 32%, 29% and 24% in three periods.
Following to the table data, courtesy of flight attendants had the highest percentage of satisfaction, there were 88% in 1999, 90% in 2000 and 92% in 2007. Courtesy of check-in/gate agents and schedules had fairly equal percentage from 75 percent to 88 percent. However, comfort of seat had the lowest percentage and only in 2007 roughly 47 percent.

279543_1.jpg
