IELTS WRITiNG PART 1: BAR CHART
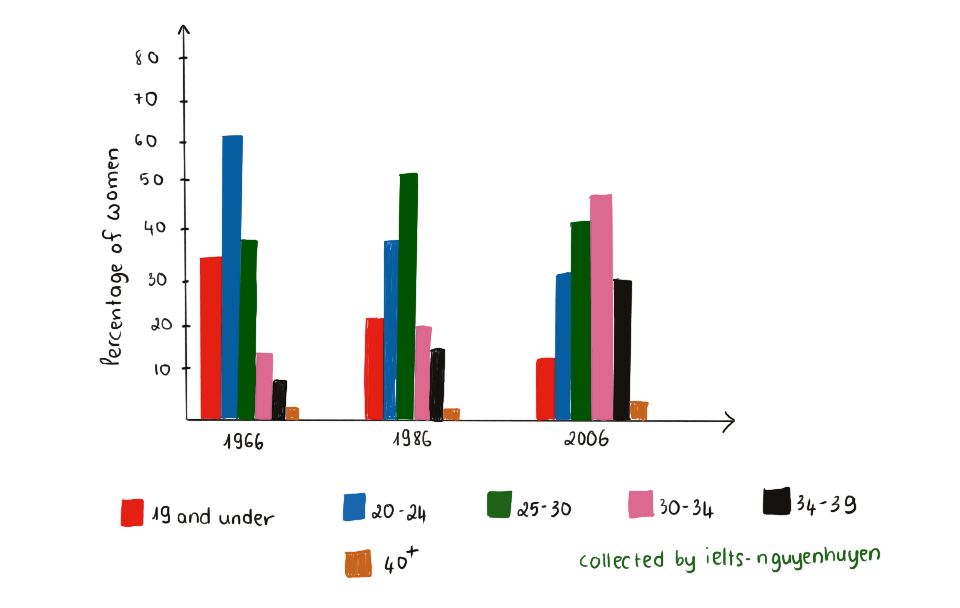
The bar chart compares and contrasts data on the changes in the proportion of women in Australia who gave birth to their first child according to 6 different age groups in 1966,1986 and 2006.
An overview of the bar chart reveals that the figure for women aged 20-24 and 19 and under witnessed a downward trend over period surveyed, while the reserve was true for the other four age groups.
The proportion of women aged 19 and under was nearly 34%, which was lower than that of the aged between 20 and 24 years old , at over 60%.Then , the year 2006 saw a moderate drop to nearly 11% in the percentage of women in the aged of 19 and under. Similarly, there was light decrease to around 30% in the figure for 20-24 years old , after 40 years.
In terms of 25 or over age group, the proportion of women aged 25-30, 30-34 years old, the aged of 34-39 and 40 or over was just over 35%, roughly 12%, nearly 8% and 3%, respectively, in 1966. Afterwards, the proportion of women who were 25-30 years old underwent a slow decline to approximately 35% in 1986.After that, this figure stayed almost unchanged until 2006. Likewise, the 30-34 age group experienced dramatic rise to about 47% after 20 years. In a similar fashion, the figure for women aged 34-39 grew a significantly to over 31% in 2006. The figure for women aged 40 or over remained stable at around 35 and 4% from 1986 to 2006.

dethiieltswriting.png
