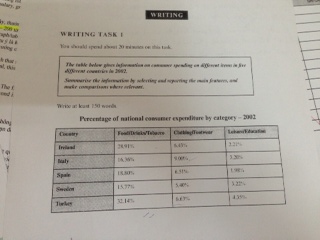
Topic: The table below give information on consumer spending on different items in five countries in 2002.(IELTS Cambridge 7 - Writing Task 1)
The table indicates the variation of consumer spending on a series of items of three group: Food/Drinks/Tobacco, Clothing/Footwear and Leisure/Education in the five countries, namely, Ireland, Italy, Spain in 2002.
Firstly, as we can see from the figures above that food, drinks and tobacco were in the most important position on consumer expenditure in all five of the five countries. To be detailed, the percentage of this kind of expenditure was around 30% in Turkey and Ireland while in other three countries, it was under 20%.
Secondly, the group of clothing and footwear took the second significant slot. Especially, Italy consumer spending on clothing/footwear has the highest percentage with 9% while that of Sweden got the lowest percentage with 5.4%.
Finally, expenditure on leisure and education is the least of all three group of items since the table shows that In Turkey, the percentage of consumer spending on leisure and education was highest with only 4.35%.
In conclusion, the figures showed in the above table the divergency of consumer expenditure on various items. The percentage of spending on food, drinks and tobacco was highest whereas that on leisure and education was lowest.

