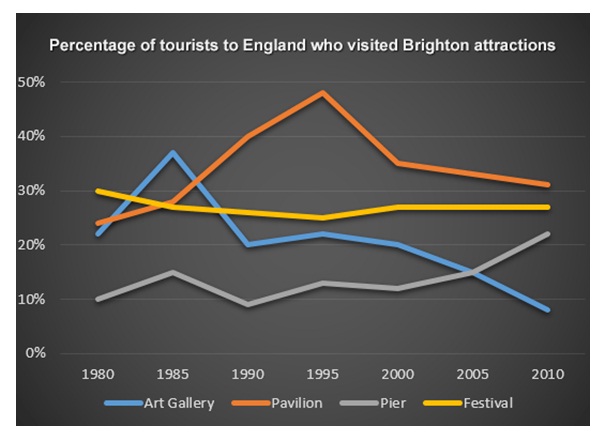
The description of alternation in visitors to the United Kingdom visiting Brighton English Attractions measured in percent from 1980 to 2010, a 30 year period is presented in line graph. The main facts that stand out reveal that the change of those traveling to England shows an erratic pattern among the frame time in which Pavilion visitors had predominant number. After overtaking Pavilion and Festival in 1985, the figure of Art Gallery plunged to the lowest level to the rest of period.
Pavilion and Festival, both gained the highest percent at approximately 23 and 30 in the initial period. Following year, the alternate changed respectively showing that Pavilion figure rose gradually over three years and reached a peak at almost 50 which was the greatest number during period given. However, it jumped considerably afterward. Next, Festival, which obtained the highest level in the first year, slightly decreased then leveled off in the periods of last just under Pavilion.
Meanwhile, Art Gallery and Piers which present a virtually similar trend subsequently rose to around 40 and 15 respectively. These two then steadily fell over the following year but in 2015 the level crossed different path in which the percentage of gallery declined considerably hitting the lowest point, whilst piers inclined to roughly 23 percent in 2015.

tourist_to_england.j.jpg
