Helo friend. Honestly I have weaknesses in observing trend in task one, especially when the task serve table and require me to make comparisons. I have problem to add number, then making comparison and also which part of the trend I should mention.Another problem is lack of vocabularies, make me often do redundancy. My exam date nearer and i still have no confident in writing. Here I try to do.
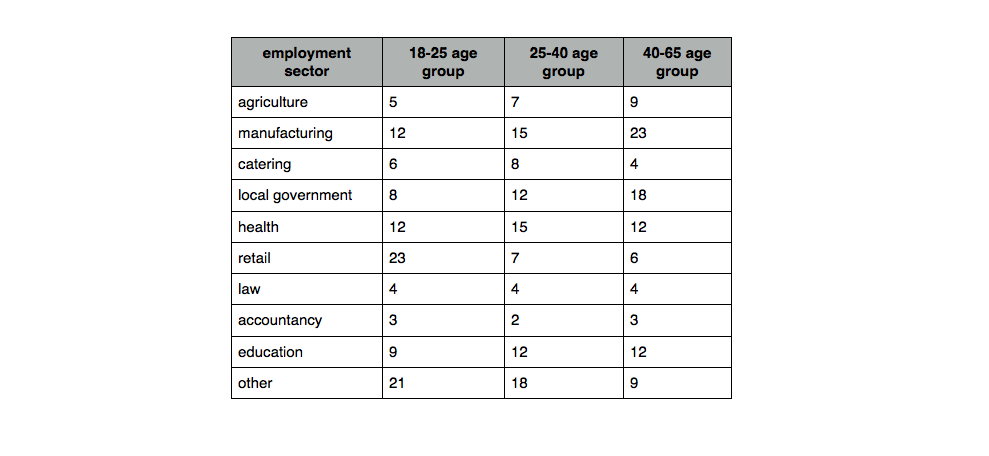
The table below shows the in which sector of the economy different age groups were employed.
Summarize the information by selecting and reporting the main features, making comparisons where relevant
===============================================================
The table compares the numbers of people in the three age groups which are employed in the particular sector of economy.
Overall, the number of people who work in each sector varied markedly, while the overall age groups show similar number of worker in law sector.
As per information, while health sector employed huge number of worker, the manufacturing sector stance as the highest numbers of economical sector employing the workforce. Next, under ten people, in each age group, work in the agriculture and catering sector, the least of people working in accountancy also shows the resemblance number. Retail and the other mentioned sector are likely to hire more young people than that of the older, while education and local government paid more mature people to work on their field.
A closer looked at the overall age group, while the variation employer in number working in the each sector, at least twelve people in the same group work in the two different sectors. In the 16-25 age groups such number shows in the manufacturing and health sector. Then, the twelve for middle age, under review, work in the local government and education also the twelve oldest workers are hired in the education and health sector.

economy_sector_tabl.png
