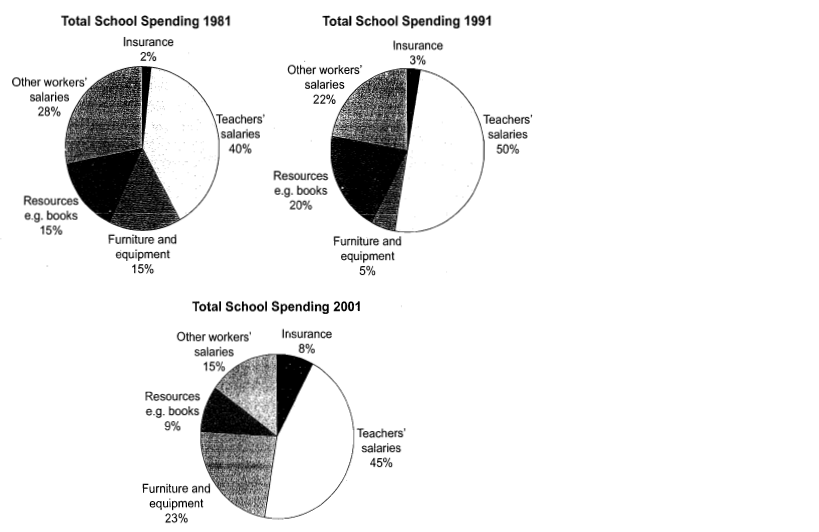
The three pie charts reveal the proportion of some kinds of expense in a particular school in the United Kingdom in 1981, 1991 and 2001. In general, the rate of salaries for teachers was the highest among other costs in all of three years, followed by payments for other workers, resources and furniture and equipment, whereas the lowest percentage was related to insurance.
More specifically, the proportion of teachers' salaries rose from 40% in 1981 to 50% in 1991 before going down back to 45% in 2001. Similarly, the percentage of resources such as books was a third higher in 1991 compared to the ratio of 15% in 1981, but dropped then to 9% in 2001. Furniture and equipment experienced an completely opposite trend as it constituted 15% of all expenses in 1981, decreased by 10% after 10 years prior to there was a sharp growth to 23% in 2001.
In regard to other workers' salaries, it made up a less and less percentage of total school expenditures, respectively 28%, 22% and 15%. By contrast, the figures for insurance constantly increased with only 2% in 1981 and 3% in 1991 to 8% in 2001.

Untitled.png
